

Traders are searching for the same answer right now:
Why is Bitcoin dropping today?
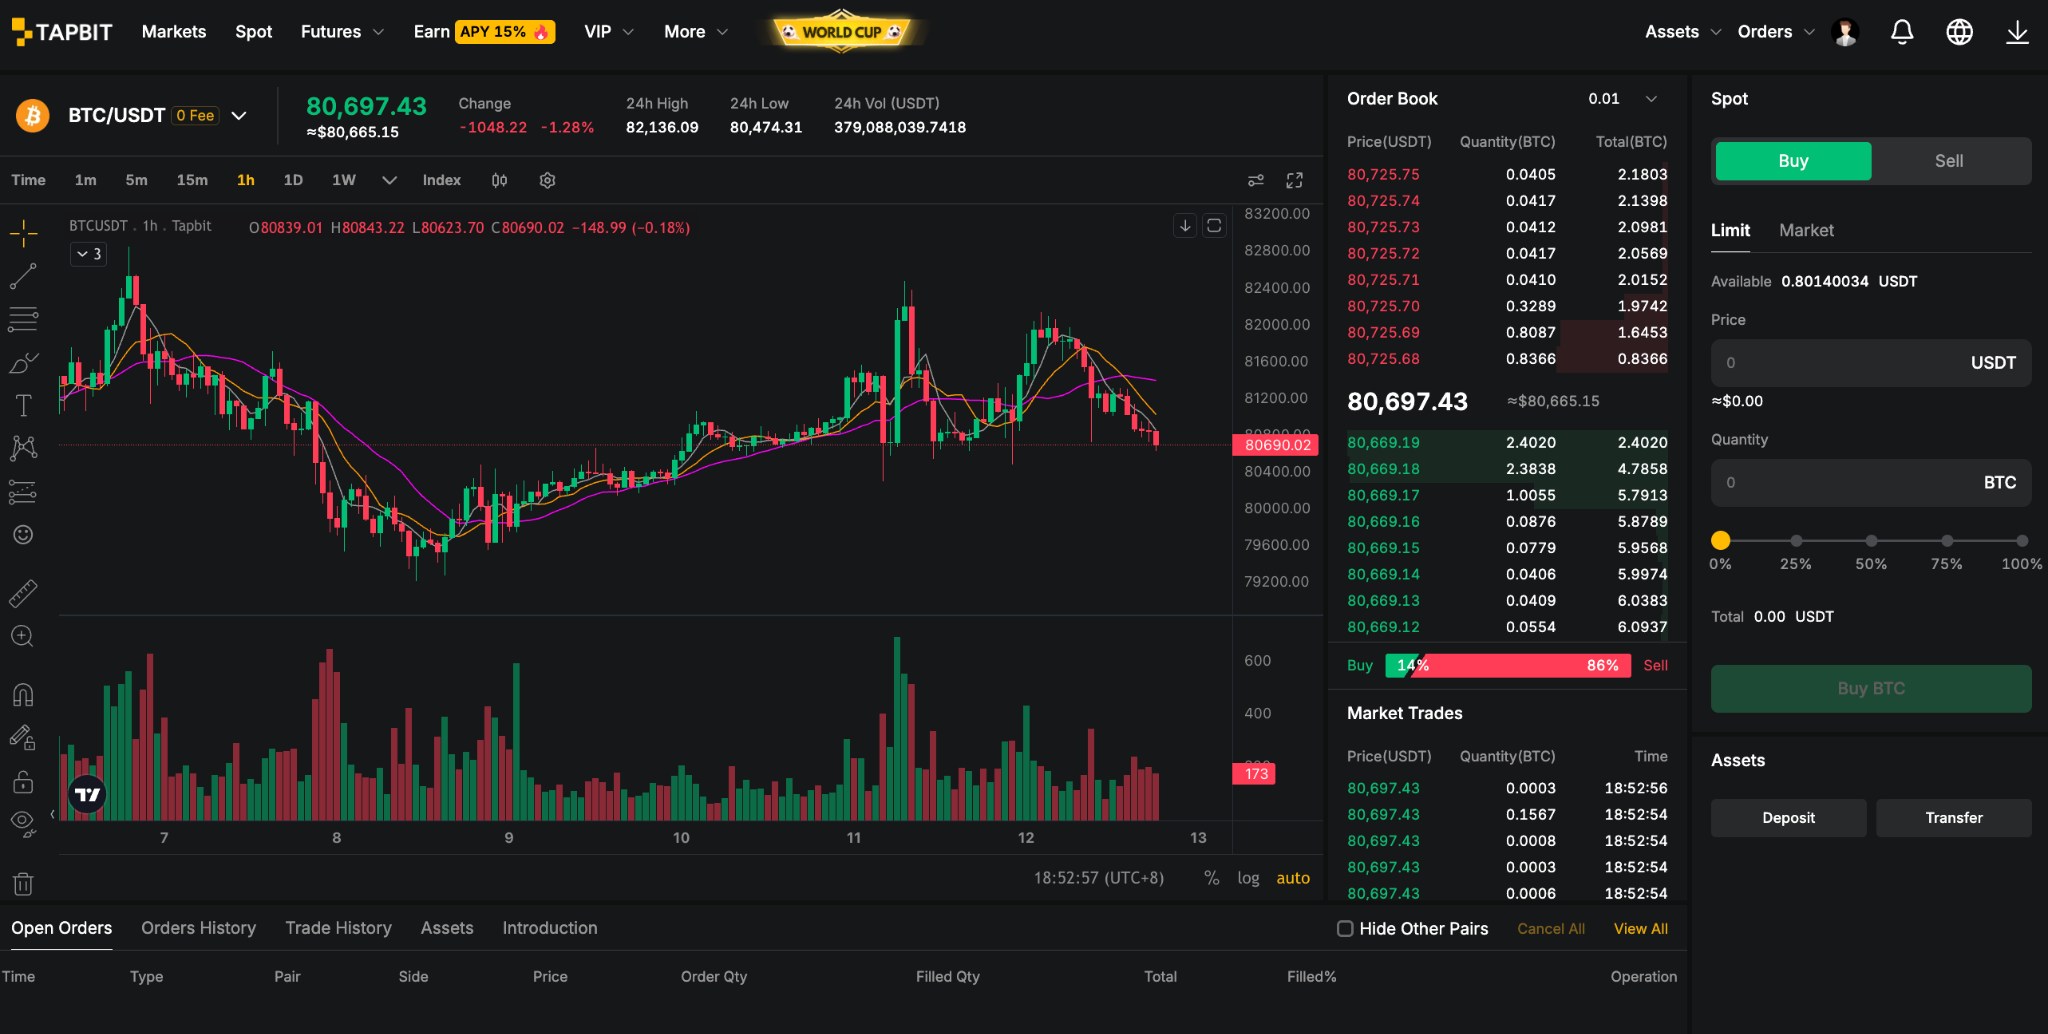
As of May 12, 2026, BTC is trading near $80,860 — trapped in a pattern that has played out four times in the past two weeks. The session opened around $80,730, dipped to $80,300 in what looked like a stop hunt, bounced sharply to a session high of $82,000, and was immediately rejected. The same seller wall sitting at the 200-day moving average ($82,228) showed up again, and Bitcoin faded back to where it started.
This is not a random choppy day. It is happening inside what many analysts are calling Bitcoin's biggest scheduled macro test of 2026 — a five-day window that includes today's US CPI release, tomorrow's PPI print, Thursday's retail sales and Fed balance sheet data, and the formal handoff of the Federal Reserve chairmanship from Jerome Powell to Kevin Warsh on May 15.
This guide breaks down:
-
Why Bitcoin is dropping today specifically
-
How ETF flows became the market's biggest variable
-
Why BTC now trades like a tech stock, not digital gold
-
What the key levels and catalysts are for the next move
-
How to navigate volatility as a trader in 2026
Why Is Bitcoin Dropping Today? Multiple Pressure Points Are Hitting at Once
Why is Bitcoin dropping today is not a question with a single answer in May 2026. Several structural and event-driven forces are converging simultaneously, and understanding each one matters.
ETF Outflows Flipped the Institutional Signal
US spot Bitcoin ETFs are now the single most important source of Bitcoin price momentum. Since their launch, these products have accumulated over $54 billion in net inflows and collectively hold BTC representing around 6.34% of total market capitalization. When they flow in, Bitcoin gets a structural bid. When they flow out, that bid disappears.
Starting April 27, US spot Bitcoin ETFs reversed into three consecutive days of net outflows, ending an inflow streak that had brought in over $2 billion since April 14. ETH spot ETFs mirrored the reversal in lockstep. The fact that both BTC and ETH ETFs sold off together points to macro-driven repositioning — not a crypto-specific story.
The most likely triggers are mechanical: Bitcoin's repeated failure to hold above $80,000 gave institutional allocators a technical reason to take profit, compounded by standard pre-FOMC de-risking and month-end portfolio rebalancing. But the ETF outflow signal matters because it removes the structural demand that had been supporting price in the $76,000–$82,000 range.
Leveraged Liquidations Are Amplifying Downside Moves
Bitcoin markets run on high leverage. When price moves sharply, leveraged long positions get liquidated automatically, creating cascading sell pressure that accelerates the move far beyond what the initial trigger would suggest.
This cycle has seen hundreds of millions in long liquidations during key drawdown sessions, with futures open interest unwinding and bullish positioning shrinking across major exchanges. It is one of the core reasons why Bitcoin can fall far faster than traditional assets — the forced selling is mechanical and indifferent to price.
Today's CPI Print: The Most Important Catalyst of the Week
The Bureau of Labor Statistics released April CPI data today, May 12, at 8:30 AM ET. This is the week's highest-stakes macro event for Bitcoin.
Context matters here. March CPI came in at 3.3% year-over-year and 0.9% month-over-month, with energy up 10.9% and gasoline up 21.2%. That was a genuine inflation shock, not a routine data scare. The question today's print has to answer is whether April shows the same heat continuing — or whether the March energy spike was a one-off pass-through that is already fading.
If CPI runs hot: real yields rise, the dollar strengthens, risk assets including Bitcoin face liquidity compression. ETF outflows could accelerate.
If CPI comes in cool: the incoming Fed Chair gains room to lean dovish. That changes the liquidity backdrop for BTC significantly and could support a relief rally.
The market is waiting for that signal before committing to the next directional move.
The Federal Reserve Chair Transition: A Pattern Bitcoin Has Never Escaped
Kevin Warsh is set to formally replace Jerome Powell as Fed Chair on May 15 — three days from today. This matters more for Bitcoin than most investors realize.
Every Fed Chair transition in Bitcoin's history has preceded a major drawdown:
-
Yellen took office, February 2014 → BTC drawdown: -83%
-
Powell's first term, February 2018 → BTC drawdown: -84%
-
Powell's second term, May 2022 → BTC drawdown: -77%
Three transitions, three crashes, zero exceptions. The pattern has held across vastly different market structures. Warsh takes over with CPI at 3.3%, oil at $115, and a Hormuz Strait blockade in its tenth week — a macro backdrop more challenging than any of his predecessors faced at the start of their terms.
The key question now is how quickly Warsh defines his policy stance. A hawkish opening would compress risk appetite further. A measured tone buys the market time to digest the transition. Until that signal comes, uncertainty alone is a headwind for BTC.
Geopolitical Tension Is Keeping Risk Appetite Suppressed
President Trump's emphatic rejection of Iran's latest peace proposal — described as "TOTALLY UNACCEPTABLE" — pushed oil prices higher and treasury yields upward this week. Gold fell. Stock futures held but with reduced conviction. Bitcoin held near $82,000 but could not sustain the level.
The Hormuz Strait blockade, now in its tenth week, is keeping a structural oil price premium embedded in global markets. That premium keeps inflation data elevated, which keeps the Fed's hands tied, which keeps real yields high, which keeps Bitcoin under pressure. The geopolitical channel is indirect but real.
What Happened to Bitcoin Today: ETF Flows Are Now Driving the Market
One of the most important structural shifts in crypto markets since 2024 is the degree to which spot Bitcoin ETFs have become the dominant source of price discovery.
In prior cycles, miners, whales, and retail traders drove the narrative. Price discovery happened on crypto-native venues, and macro was a secondary input. That dynamic has reversed. ETF flows now function as the primary transmission channel between institutional sentiment and Bitcoin's spot price.
The data from May 2026 makes this concrete:
-
Morgan Stanley's newly launched Bitcoin ETF drew $194 million in early inflows, signaling sustained institutional appetite even during a risk-off period
-
CME is preparing to launch Bitcoin volatility futures — regulated derivatives for hedging BTC price swings — a product that only makes sense in a mature institutional market
-
The Digital Asset Market Clarity Act (CLARITY Act) Senate Banking Committee hearing is scheduled for May 14, with regulatory clarity potentially unlocking another layer of institutional participation
Bitcoin is increasingly pricing like an institutional macro asset. Some analysts now argue that ETF flow trends matter more to short-term price discovery than the Bitcoin halving itself. Whether that framing holds over the full cycle remains to be seen, but in the near term, tracking daily ETF net flows has become as important as reading the chart.
Bitcoin Is Trading More Like a Tech Stock Than Digital Gold
Many investors still think of Bitcoin as a store of value that moves independently of financial markets. The actual behavior in 2026 tells a different story.
When bond yields rise, when liquidity tightens, when the Fed turns hawkish — Bitcoin sells off alongside Nasdaq stocks, AI-related equities, and other high-beta risk assets. The correlation is not perfect, but it is persistent and increasingly hard to ignore.
Bitcoin now trades through several of the same transmission channels as equities and credit:
Real yields: A hot CPI print lifts nominal yields. If real yields rise, the discount rate on future cash flows increases and high-beta assets reprice lower. Bitcoin is not immune to this mechanism.
The dollar: Bitcoin has a well-documented inverse relationship with the US Dollar Index. When the dollar strengthens on the back of higher yields, Bitcoin tends to weaken. The current setup — rising oil, elevated CPI, hawkish Fed transition — is dollar-supportive in the short term.
ETF allocation flows: Institutional allocators now move in and out of Bitcoin through the same portfolio management processes they use for equities. Risk-off sentiment that causes equity ETF outflows often triggers Bitcoin ETF outflows simultaneously.
Leverage conditions: Elevated leverage ratios in crypto futures markets amplify the directional moves that macro catalysts initiate.
This does not mean Bitcoin has abandoned its long-term narrative. US spot Bitcoin ETFs hold over $54 billion in cumulative net inflows. On-chain supply sits at a seven-year low. Whales are still accumulating. The long-term structural case remains intact. But in the near term, Bitcoin is behaving like a high-volatility macro asset, and traders who treat it otherwise get caught offside.
Will Bitcoin Recover or Keep Falling?
The question everyone wants answered: will Bitcoin go back up?
The honest answer is that the next directional move depends on how several key variables resolve over the next 72 hours.
The bull case for a recovery:
-
Today's April CPI comes in below expectations, easing real yield pressure
-
Warsh opens his Fed tenure with measured, data-dependent language rather than explicit hawkishness
-
Bitcoin holds $80,000 support and avoids triggering fresh stop cascades
-
ETF inflows resume following the Fed Chair handoff, confirming that the outflow was positioning-driven rather than a structural shift in demand
-
The $80,711–$80,730 level holds as a technical anchor, validating the bullish setups analysts have been tracking
The bear case for continued pressure:
-
CPI surprises to the upside, forcing a repricing of rate expectations under Warsh
-
BTC breaks below $80,000, triggering leveraged liquidations and a potential test of $79,000
-
ETF outflows continue through the transition period, removing the institutional bid
-
Warsh signals a hawkish stance early, compressing risk appetite further
-
The Hormuz situation escalates, pushing oil and inflation expectations higher
Most analysts currently frame this as a deleveraging phase rather than a full structural breakdown. The Fear and Greed Index at 47 (Neutral) suggests retail has not capitulated or FOMO-ed in — usually a sign that the market has room to move in either direction once the catalysts resolve.
Key levels to watch:
-
Support: $80,730 (session open) / $80,000 / $79,000
-
Resistance: $82,000 / $82,228 (200-day MA) / $85,000
Is It a Good Time to Buy Bitcoin Right Now?
This is where emotion tends to override analysis. The answer depends entirely on your strategy and risk tolerance — and there is no universal right answer.
For long-term investors, many experienced participants use corrections like this one as an opportunity to dollar-cost average (DCA) rather than trying to call the exact bottom. Staggered entries reduce the risk of catching the worst possible level.
For active traders, the setup right now is defined by a clearly identified range: support around $80,000 and resistance at $82,228 (200-day MA). A confirmed break in either direction gives a cleaner entry signal than chasing the middle.
For newcomers, high-leverage environments like the current one can be punishing. Understanding the macro calendar — CPI today, PPI tomorrow, retail sales Thursday, Fed Chair transition Friday — and sizing positions accordingly is more important than picking a direction.
What the data does confirm is that institutional adoption has not reversed. Long-term holders and whales are still accumulating at current levels. On-chain supply on exchanges continues to decline. The structural thesis for Bitcoin has not broken. But timing and position sizing in this environment matter more than usual.
Monitor live Bitcoin price and market conditions here:
How to Trade Bitcoin During Volatility on Tapbit
Volatility creates both risk and opportunity. The most effective traders in periods like this tend to be clear about which approach they are using — and why.
Spot accumulation works well for investors who have a long-term view and want to use the current dip to build a position gradually, without the liquidation risk that comes with leverage.
Futures hedging allows traders who already hold spot BTC to open short positions that offset downside exposure during uncertain macro windows — effectively buying insurance while keeping the underlying position.
Short-term momentum trading suits experienced traders who can move quickly when CPI or Warsh's first statements land and create directional conviction in the market.
On Tapbit, you can:
-
Monitor real-time Bitcoin market movements and price action
-
Trade BTC spot markets with full position control
-
Access BTC futures trading for both long and short exposure
-
Manage and adjust positions efficiently during fast-moving markets
Useful links:
For beginners, spot trading carries significantly lower risk than futures during periods of elevated volatility. More experienced traders can use futures carefully to hedge existing positions or capture short-term directional moves after key data releases.
Final Thoughts
Why is Bitcoin dropping today is a question with a clear, multi-part answer in May 2026.
BTC is being pressured by the convergence of ETF outflows that ended a $2 billion inflow streak, today's April CPI print that could reshape rate expectations under an incoming Fed Chair, a 200-day moving average that has rejected price four times in two weeks, and persistent macro uncertainty tied to oil prices and geopolitical risk.
The deeper shift is structural. Bitcoin no longer trades purely on crypto-native narratives. It moves through real yields, the dollar, ETF allocation flows, leverage conditions, and the same liquidity variables that shape equities and credit. Understanding those transmission channels is what separates reactive trading from informed decision-making.
Short-term volatility will continue. The next 72 hours — CPI, PPI, CLARITY Act hearing, and the Fed Chair handoff — will determine which direction Bitcoin resolves from its current range. What matters most right now is watching the right variables, managing risk accordingly, and not letting a few red candles override a well-reasoned position.
FAQ
Why is Bitcoin dropping today?
Bitcoin is dropping today due to a combination of spot ETF net outflows that began April 27, macro uncertainty ahead of today's CPI release, the impending Federal Reserve Chair transition from Powell to Warsh on May 15, and repeated technical rejection at the 200-day moving average near $82,228.
What happened to Bitcoin today?
BTC opened near $80,730 on May 12, 2026, dipped to $80,300, bounced to a session high of $82,000, and was rejected at the 200-day moving average for the fourth time in two weeks. The market is in a holding pattern waiting for the April CPI print to set the next directional tone.
Will Bitcoin go back up?
Bitcoin could recover if today's CPI comes in below expectations, if incoming Fed Chair Warsh signals a measured rather than hawkish policy stance, and if ETF inflows resume following the leadership transition. A sustained hold above $80,000 would be the first technical confirmation of stabilization.
Is it a good time to buy Bitcoin right now?
That depends on your strategy and risk tolerance. Long-term investors often use corrections like this to dollar-cost average rather than timing the exact bottom. Active traders are watching the $80,000 support and $82,228 resistance for a confirmed directional break before entering.
Why does Bitcoin crash so fast?
Bitcoin markets carry high leverage, and forced liquidations during sharp moves create cascading automated sell orders that amplify the initial drop significantly beyond what the triggering catalyst alone w


