

XST has fallen 52.12% in the supplied weekly market snapshot, bringing its displayed price to approximately $0.00004. The decline appears severe, but the chart alone cannot confirm a single cause. The most likely pressures include thin liquidity, profit-taking after earlier gains, inconsistent demand and confusion between different tokens using the XST ticker.
Can XSolutAI recover? It can rebound if trading liquidity improves and the project provides clearer evidence of active development and token utility. A temporary price bounce, however, would not by itself prove that the longer-term market has recovered.
XST does not appear to be a supported Tapbit trading pair. Users can still create a Tapbit account to explore supported crypto markets and trading tools while researching decentralized assets separately.
What Does the Latest XST Price Chart Show?
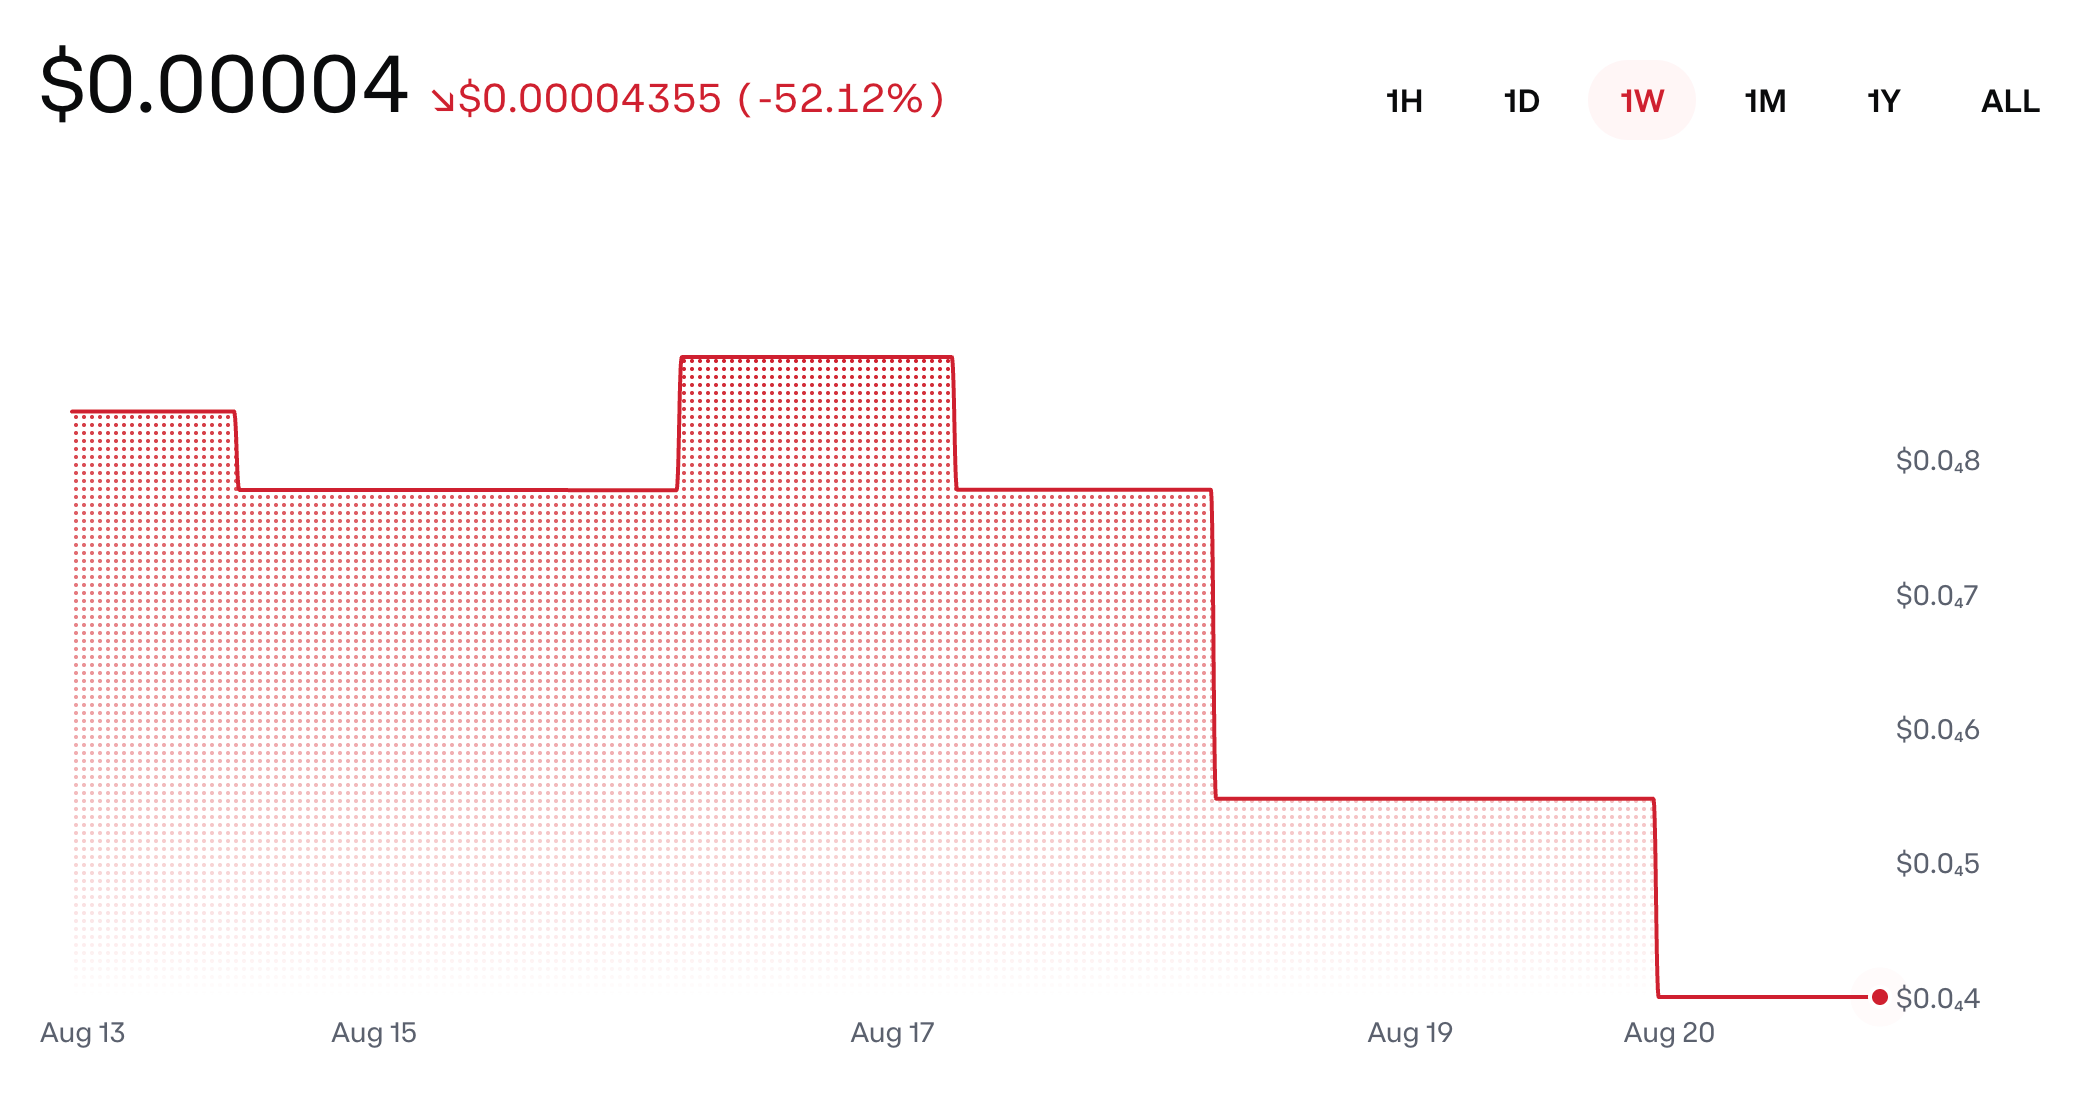
The supplied chart places XST near $0.00004 after a decline of approximately $0.00004355, equivalent to 52.12%. The selected period is one week, covering roughly August 13 to August 20.
Price remained near the upper part of the weekly range during the first several days before dropping in a series of abrupt steps. The final move took XST close to the lowest level shown on the chart.
This structure differs from the continuous price action normally seen in a highly liquid market. Large sections remain almost flat before instantly repricing lower. That pattern can appear when trades are infrequent, liquidity is limited or a market-data provider receives occasional updates.
Why Is XSolutAI Down 52%?
The chart does not identify which wallets sold or whether a specific project event caused the decline. Several market mechanisms could nevertheless explain the move.
Limited liquidity is the first possibility. When relatively little capital is available in a decentralized exchange pool, one meaningful sale can move the quoted price far more than it would in a deep market. The decline may therefore reflect a small number of transactions rather than broad selling by thousands of holders.
Profit-taking is another possibility. Small-cap AI tokens can rally rapidly when their narratives attract attention. Early buyers may then sell into new demand, causing a sharp reversal once the number of new buyers declines.
Ticker confusion also matters. XST is used by more than one crypto asset, and users searching by symbol may encounter XSolutAI, Stealth or another unrelated token. Trading data from the wrong contract can produce misleading comparisons.
XST Price Chart and Liquidity Signals
The step-like chart makes liquidity the most important issue to investigate. A displayed price tells users where a recent transaction occurred, but it does not guarantee that a larger position can be sold at the same valuation.
Before interpreting the decline as a buying opportunity, traders should compare pool liquidity with the size of their intended transaction. They should also inspect recent sales, trading volume, holder concentration and expected price impact.
| Signal | Healthier Condition | Higher-Risk Condition |
|---|---|---|
| Liquidity | Deep, active pools | Small pool relative to market value |
| Volume | Consistent trades from many wallets | Long gaps between trades |
| Price action | Continuous bids and offers | Flat lines followed by sudden steps |
| Holders | Broadly distributed supply | A few wallets control most tokens |
| Contract identity | Same mint across reliable channels | Different addresses use the XST name |
A token can show a rising market value while still having little exit liquidity. Market capitalization should therefore be examined alongside the capital actually available in trading pools.
Is the 52% Drop a Buying Opportunity?
A lower price does not automatically make XST undervalued. Valuation depends on what the token provides, how it is used and whether demand can grow beyond short-term speculation.
The decline may attract buyers if they believe XSolutAI can deliver a functioning AI product, grow its user base and connect token demand to real platform activity. That argument becomes stronger when there are verifiable product releases, active developers, transparent token economics and sustained usage.
The opposite interpretation is that the price is adjusting to weak demand and insufficient liquidity. If the previous valuation was driven primarily by AI-token attention, falling 52% may not be enough to establish a durable bottom.
Can XST Recover?
XST can recover in price, but recovery should be defined more carefully than a brief rebound. A sustainable improvement would require stronger liquidity, higher trading volume and a sequence of higher lows rather than one isolated green candle.
| Scenario | Conditions | Possible Result |
|---|---|---|
| Bullish recovery | New utility, deeper liquidity and consistent demand | XST reclaims part of the weekly decline |
| Temporary bounce | Speculative buying without structural improvement | Sharp rally followed by renewed selling |
| Continued weakness | Liquidity contracts and development remains unclear | Price tests new lows or becomes difficult to trade |
The first levels to watch are the previous step-down zones. XST would need to reclaim them and hold them as support. If every rebound is met by new selling, the market has not established a reversal.
What Would Support a Stronger Recovery?
Project execution is the most important long-term variable. The AI label may attract attention, but users need evidence of what XSolutAI provides and why the XST token is necessary within that system.
Improved documentation would also help. Investors should be able to identify the correct mint address, understand token supply and permissions, and distinguish XSolutAI from unrelated assets using XST.
Liquidity must grow alongside attention. A healthier market requires enough capital to absorb both purchases and sales without extreme price impact.
Key Risks After the XST Price Crash
Contract confusion remains one of the most immediate risks. Names, logos and tickers can be copied, while the complete blockchain address identifies the actual asset.
Low liquidity increases both trading costs and exit risk. A user may successfully make a small purchase but receive a much worse price when trying to sell a larger amount. Liquidity providers can also remove capital without warning.
The chart’s abrupt steps suggest that percentage moves should be interpreted cautiously. A 52% decline is important, but it may describe the behavior of a very small market rather than a broadly traded asset.
Conclusion
XST is down 52.12% in the supplied weekly snapshot, with the displayed price near $0.00004. Thin liquidity, profit-taking and uncertainty about the token’s identity and utility are more credible explanations than assuming the decline has one confirmed cause.
XSolutAI can recover if it demonstrates verifiable utility, attracts sustainable demand and develops deeper liquidity. Until those conditions appear, a short-term bounce should not be confused with a complete recovery.
Frequently Asked Questions
Why did XST fall 52%?
The exact cause cannot be confirmed from the chart alone. Thin liquidity, large individual sales, profit-taking and weaker speculative demand are plausible factors.
Can XST recover after the crash?
A rebound is possible, but a sustainable recovery would require stronger liquidity, consistent volume and evidence of real XSolutAI usage.
Is XST available on Tapbit?
XST does not appear to be a supported Tapbit trading pair. A general Tapbit link should not be interpreted as confirmation of a listing.
Why does the XST chart move in steps?
Step-like price action may occur when trades are infrequent, liquidity is thin or market data updates only after occasional transactions.
How can users identify the correct XST token?
Verify the complete contract or mint address through consistent project channels and compare it with the address shown by the active liquidity pool.


