

Bitcoin is trading close to $72,000 after a strong daily rebound, putting the market back within reach of an important resistance zone. The supplied BTC/USDT snapshot shows Bitcoin near $71,906, up approximately 3.71%, with a 24-hour high of $72,471 and a low of $64,455.
The recovery is encouraging, but Bitcoin has not confirmed a sustained breakout. Buyers must defend the rebound and produce a daily close above nearby resistance before the move can be treated as more than a volatility-driven recovery.
Traders can follow the market through the BTC/USDT spot pair on Tapbit, where current prices, order-book liquidity and trading volume can be monitored.
Bitcoin Price Today: BTC Rebounds Toward $72,000
Bitcoin’s move from below $65,000 to almost $72,000 represents a sharp change in short-term momentum. The screenshot shows a daily gain of more than $2,570 and 24-hour volume above $1.16 billion on the displayed market.
The rebound also pushed BTC above the short-term moving averages visible on the chart. This suggests buyers have regained control of the immediate trend, although one strong candle is not enough to establish a durable reversal.
Bitcoin is now approaching an area where previous sellers may return. Traders who bought near the recent lows may take profits, while participants who entered at higher prices could use the recovery to reduce exposure.
Why the $72,000–$72,500 Area Matters
The first resistance zone sits between approximately $72,000 and the displayed 24-hour high near $72,471. Bitcoin has already tested this region, so the next move depends on whether demand can absorb the available sell orders.
A short-lived move above $72,500 would not automatically confirm a breakout. Stronger confirmation would include a daily close above the level, continued trading volume and an ability to hold $72,000 during a subsequent pullback.
If Bitcoin breaks resistance but quickly falls back below it, the move may become a bull trap. That would suggest buyers lacked enough conviction to maintain the higher price range.
BTC/USDT Price Chart and Market Structure
The broader chart shows that Bitcoin remains below earlier peaks around $80,000–$82,000. The latest rally therefore improves short-term momentum without fully repairing the wider market structure.
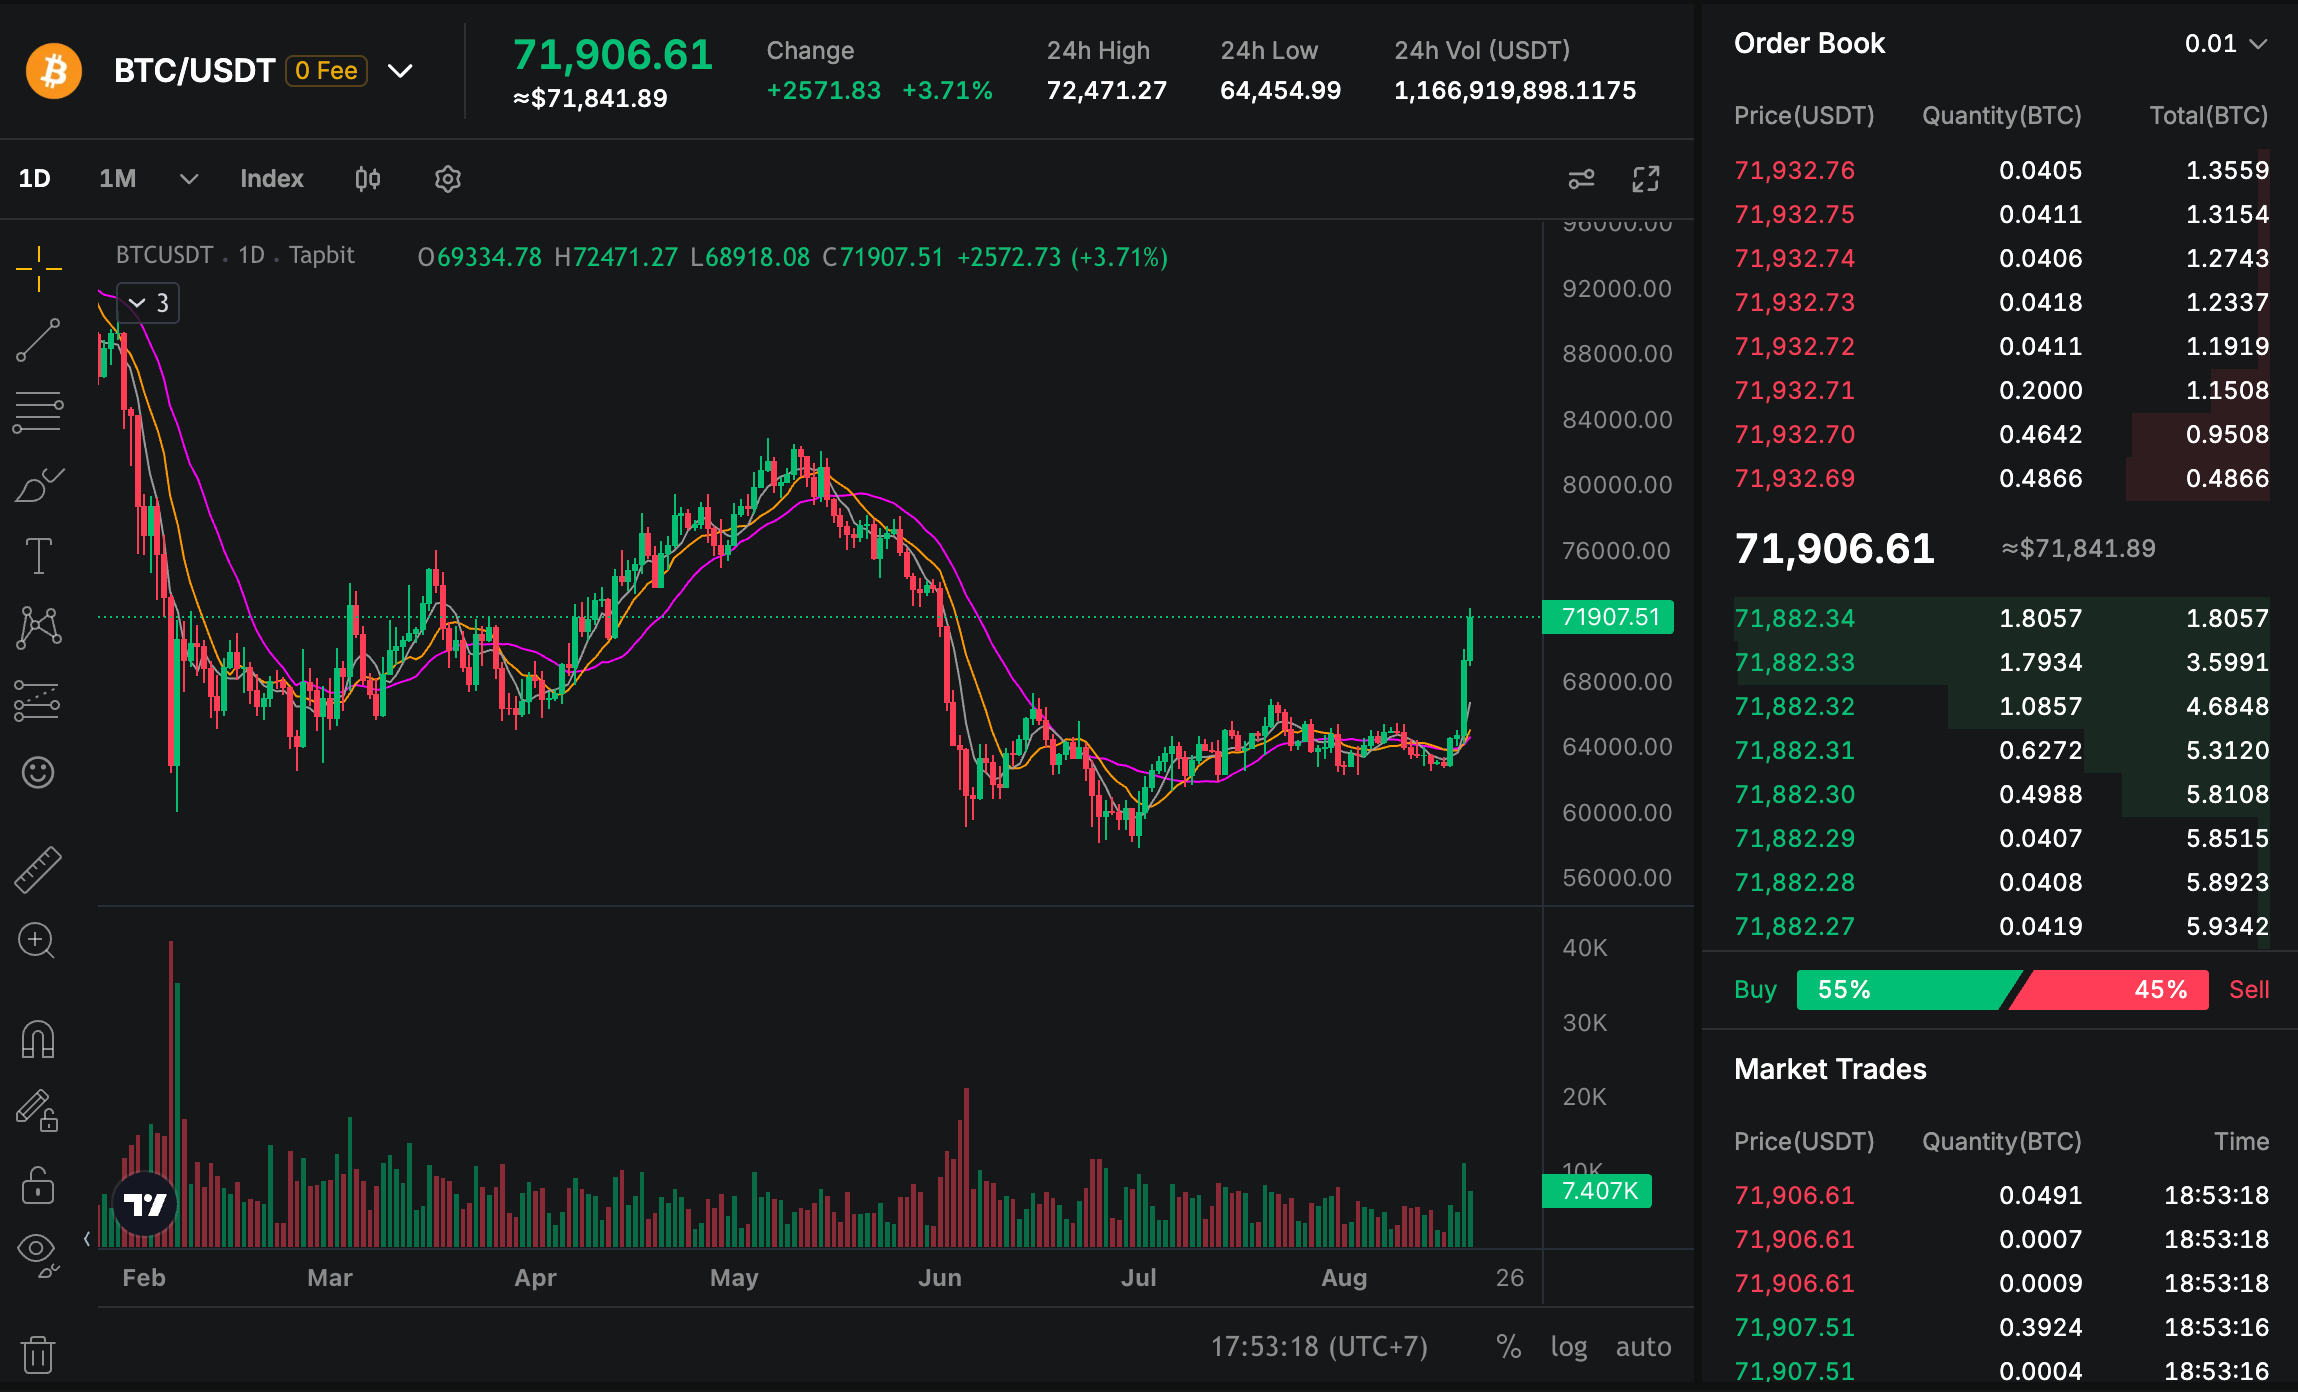
BTC previously spent time consolidating around $63,000–$66,000. The rapid advance from that range means the market could retest part of the breakout if buyers lose momentum. A controlled pullback that holds above previous resistance would be healthier than an immediate return to the former range.
Bullish Scenario: Bitcoin Breaks Above $72,500
A confirmed close above $72,500 could shift attention toward $75,000–$76,000. This area may act as the next intermediate resistance before BTC attempts to recover the psychologically important $80,000 level.
For the bullish scenario to remain credible, Bitcoin should ideally hold above $70,000 after the breakout. Rising spot volume and sustained demand would also help distinguish a genuine trend change from a leveraged squeeze.
If BTC eventually moves above $80,000, the market could begin discussing a return to the previous highs around $82,000 and beyond. That outcome, however, requires several resistance levels to be reclaimed first.
| Scenario | Confirmation | Potential Area |
|---|---|---|
| Bullish breakout | Daily close above $72,500 | $75,000–$76,000 |
| Strong continuation | BTC holds above $76,000 | $80,000–$82,000 |
| Consolidation | Price remains between $68,000 and $72,500 | Range-bound trading |
| Bearish rejection | Loss of $68,000 | $64,500–$66,000 |
Bearish Scenario: BTC Fails at Resistance
If Bitcoin repeatedly fails to hold above $72,000, short-term buyers may begin taking profits. The first area to monitor would be approximately $70,000, followed by the former breakout region near $68,000.
A drop below $68,000 would weaken the current recovery and could return BTC toward $64,500–$66,000. That zone previously acted as a consolidation area and may attract buyers again.
The more concerning signal would be a loss of the recent low near $64,455. Such a move would suggest that the rebound failed to change the broader bearish structure, increasing the possibility of another test of $60,000.
What Could Drive Bitcoin’s Next Move?
Bitcoin’s next move will depend on more than chart resistance. Broader market liquidity, institutional flows, interest-rate expectations and risk sentiment can all affect demand.
Traders should also monitor whether the rally is supported by spot buying or primarily driven by derivatives. A heavily leveraged move can reverse quickly if funding becomes expensive or long positions are forced to close.
Volume is particularly important around $72,500. A breakout accompanied by expanding volume is generally more convincing than a low-volume move during thin trading conditions.
Conclusion
Bitcoin’s recovery toward $72,000 has improved short-term momentum, but the market is now testing an important decision area. A sustained daily close above $72,500 could open a path toward $76,000 and eventually $80,000.
Failure to hold the breakout would leave BTC vulnerable to a pullback toward $70,000 or $68,000. The key question is therefore not whether Bitcoin can briefly trade above resistance, but whether buyers can keep it there.
Frequently Asked Questions
What is Bitcoin’s next resistance level?
The first important resistance is approximately $72,000–$72,500. Above that range, traders may watch $75,000–$76,000 and $80,000.
Is Bitcoin bullish above $72,000?
Trading above $72,000 improves short-term momentum, but stronger confirmation would require a daily close above $72,500 and continued buying volume.
What happens if Bitcoin is rejected at $72,500?
A rejection could trigger a pullback toward $70,000 or $68,000. Losing $68,000 may expose the previous consolidation range near $64,500–$66,000.
Can Bitcoin return to $80,000?
Bitcoin could retest $80,000 if it establishes support above $72,500 and then breaks through the $75,000–$76,000 resistance area.


