

Gold remains one of 2026’s most volatile major assets. XAU/USD surged above $5,500 per ounce intraday in January before briefly falling below $4,000 in June. By August 27, spot gold had recovered to roughly $4,600, leaving the market below its record but close enough to make $5,000 the defining psychological level for the next leg.
Traders who want crypto-market access to tokenized gold can explore XAUT/USDT spot trading on Tapbit. XAUT is a tokenized gold asset and is not identical to the institutional XAU/USD over-the-counter spot quote, so prices, trading hours, spreads, custody arrangements, and market structure can differ.
Gold Price Today: Where Is XAU/USD Trading?
Spot gold traded around $4,600 per ounce on August 27, 2026. Reuters reported a quote near $4,599.57 at 08:52 GMT after gold fell 1.4% in the previous session. The move followed a recovery from June’s sub-$4,000 low and a rally to a three-month high earlier in August.
The current position is important. Gold is well above its mid-year low but still about 16% below the January intraday peak above $5,500. A move back to $5,000 would therefore be a recovery toward a previously traded region, not an unprecedented new high.
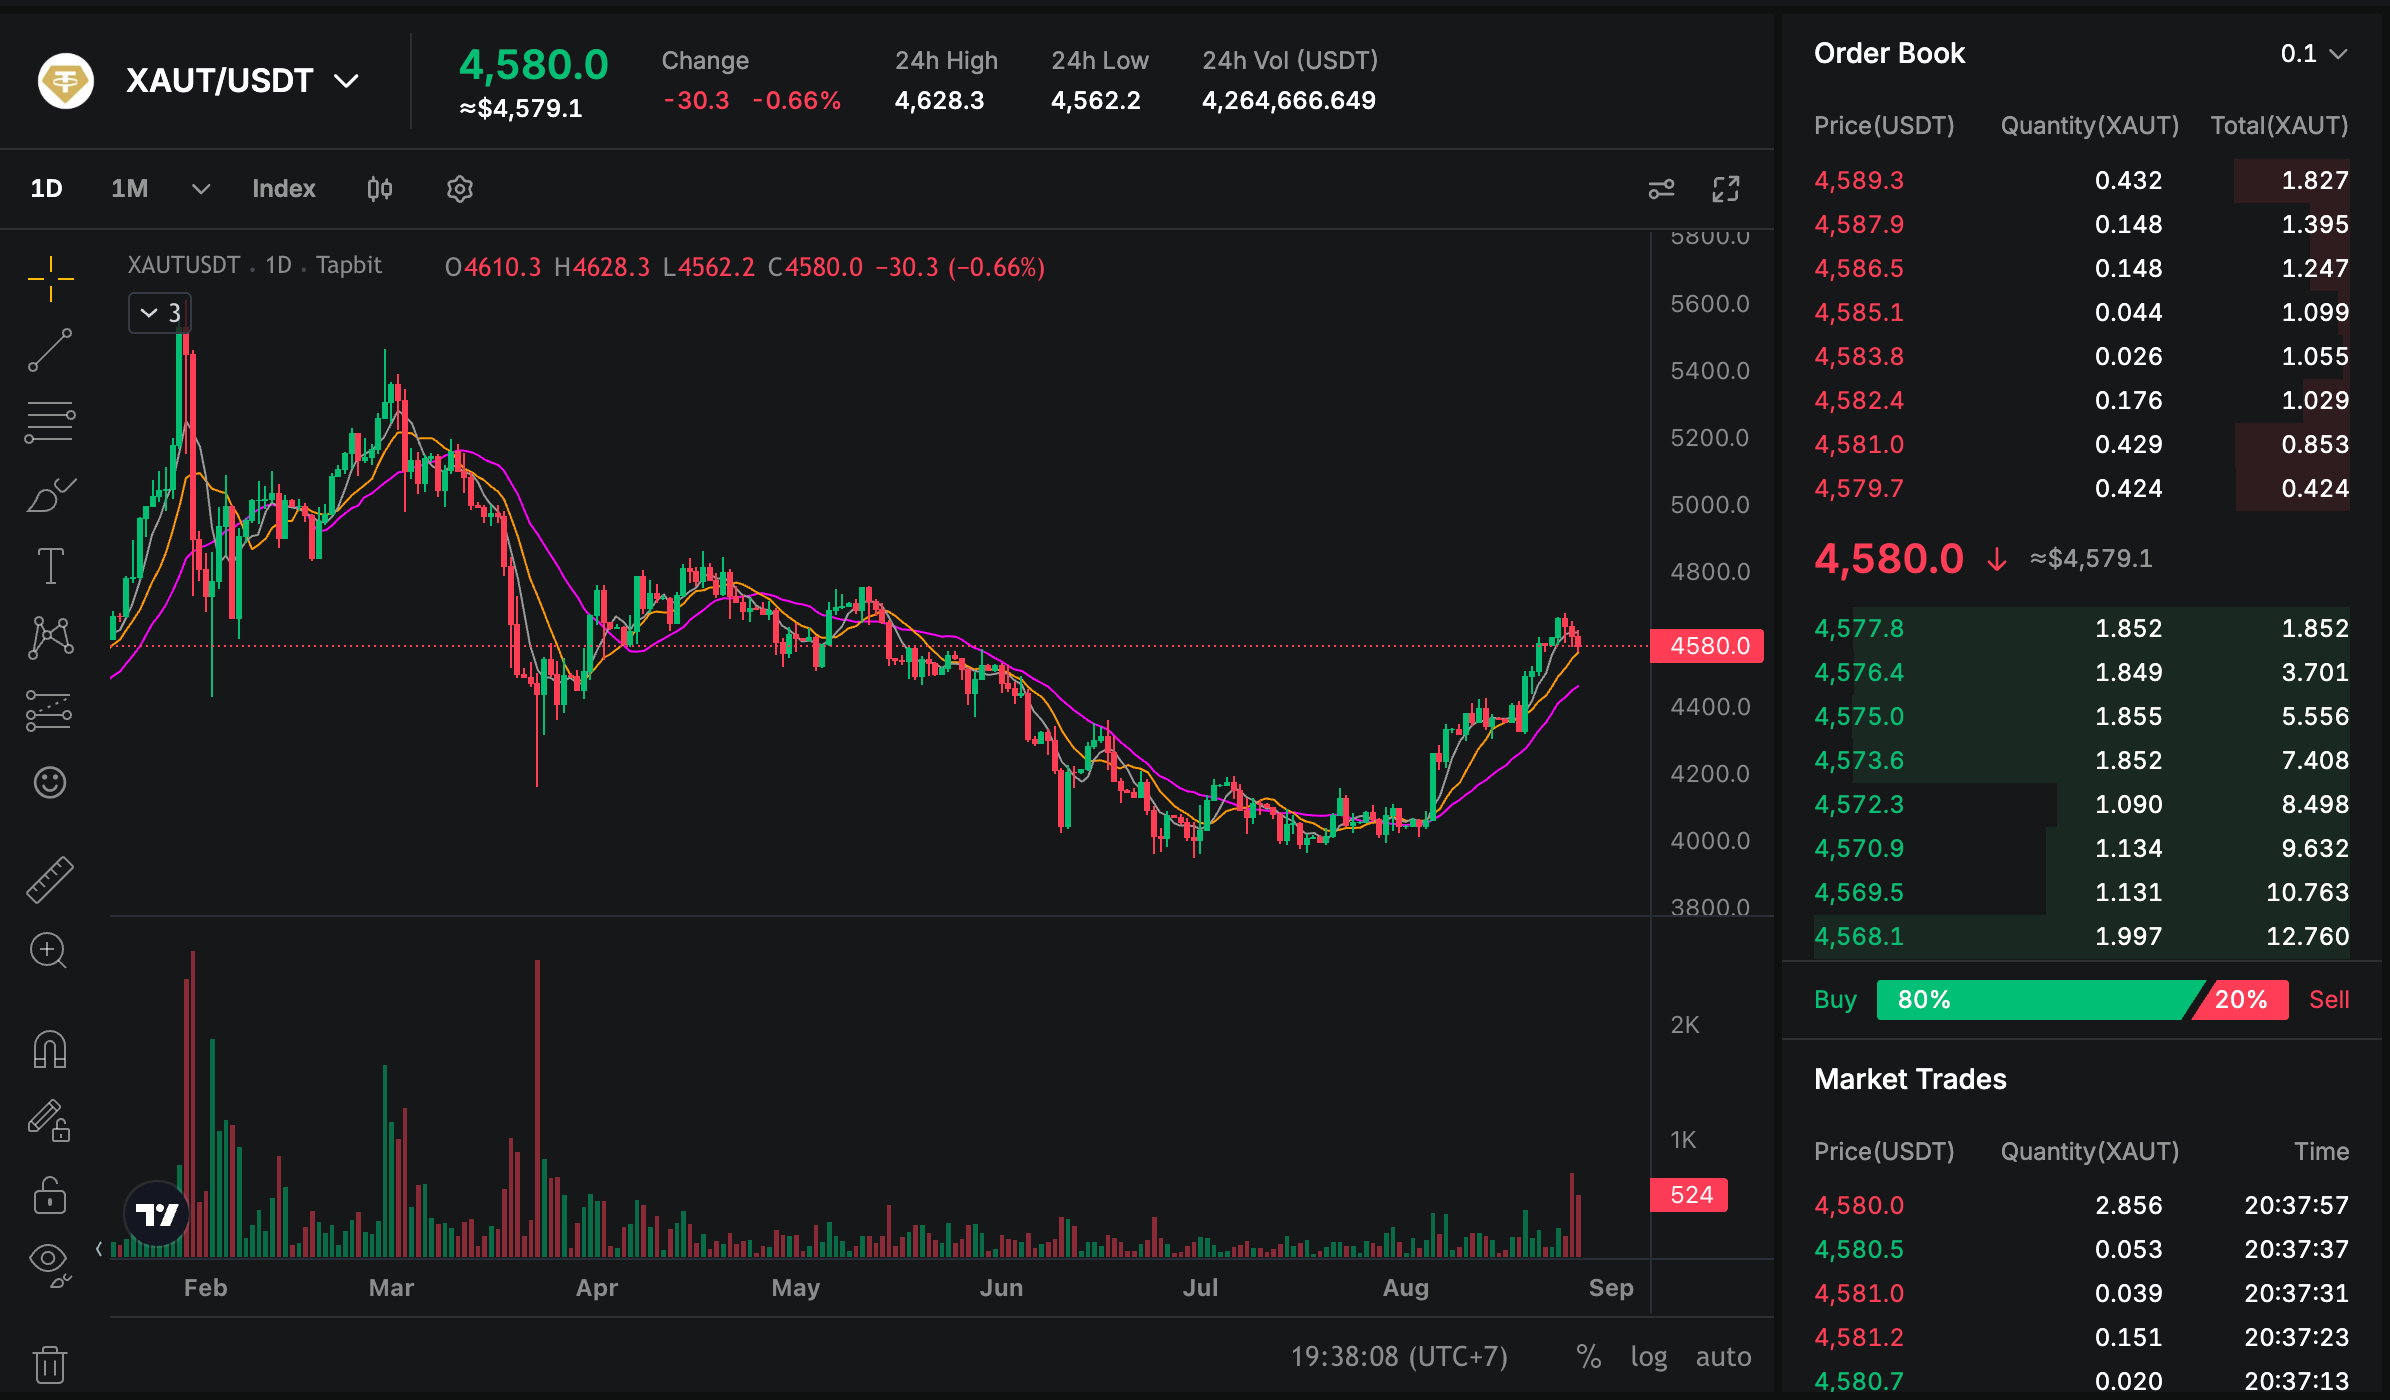
Why Gold Fell After Reaching Record Highs
The early-2026 spike reflected geopolitical stress, elevated options activity, reserve diversification, and momentum buying. Those conditions became less extreme, while higher real yields increased the opportunity cost of holding an asset that pays no interest. Profit-taking then amplified the reversal.
The correction also exposed how positioning can matter. When speculative exposure becomes crowded, a stronger dollar or a change in rate expectations can trigger rapid liquidation even when the long-term case for gold remains intact.
Can Gold Reclaim $5,000 in 2026?
Yes, but the move needs a catalyst. The World Gold Council’s mid-year outlook said gold could resume its upward trend around $4,500, while a strong signal may be required to push it sustainably toward $5,000. Potential triggers include worsening geopolitical conditions, a reversal in interest-rate expectations, or renewed long-term investor participation.
From approximately $4,600, reaching $5,000 requires a gain of about 8.7%. That is achievable within gold’s demonstrated 2026 volatility, but holding above the level would be harder than briefly touching it. A durable breakout would likely need ETF inflows and central-bank demand to offset selling from higher real yields.
Gold Price Prediction for 2027–2030
Long-range gold forecasts should be treated as scenarios, not precise promises. Inflation, fiscal policy, mine supply, central-bank behavior, currency reserves, and geopolitical risk can change significantly over four years. The base case below assumes continued official-sector demand and gradual monetary normalization without a severe global crisis.
Bull, Base and Bear Case Forecasts
| Year | Bear Case | Base Case | Bull Case |
|---|---|---|---|
| 2026 | $3,800 | $4,400 | $5,100 |
| 2027 | $3,700 | $4,650 | $5,500 |
| 2028 | $3,900 | $4,900 | $5,900 |
| 2029 | $4,000 | $5,150 | $6,300 |
| 2030 | $4,200 | $5,400 | $6,800 |
The bear case reflects persistently high real rates, a stronger dollar, softer inflation, and fading safe-haven demand. The base case assumes central-bank buying creates a structural floor while investment flows remain cyclical. The bull case would require stronger reserve diversification, monetary easing, geopolitical shocks, or sustained ETF accumulation.
How Fed Policy and Real Yields Affect Gold
Gold is particularly sensitive to inflation-adjusted bond yields. Research from the Federal Reserve Bank of Chicago describes a strong inverse relationship between gold and long-term real interest rates. When real yields rise, investors can earn more from inflation-protected government bonds, making non-yielding gold relatively less attractive.
Rate cuts do not automatically lift gold. Markets often price policy changes in advance, and gold also responds to the dollar, growth expectations, risk sentiment, and global demand. The most supportive combination is usually falling real yields alongside a weaker dollar and rising uncertainty.
Central Bank Buying and ETF Demand
Official-sector demand remains a central pillar of the long-term case. The World Gold Council’s 2026 survey found that 89% of reserve managers expect global central-bank gold holdings to increase over the next 12 months. A record 45% expected their own institutions to add gold.
ETF demand is more price-sensitive. Strong inflows can accelerate a breakout because funds must acquire exposure, while redemptions can deepen corrections. Investors should monitor reported ETF holdings alongside central-bank purchases rather than treating either source of demand in isolation.
Key XAU/USD Support and Resistance Levels
The $4,500–$4,600 area is the first zone to watch because it contains the current recovery range. Below it, $4,200 and $4,000 are more important supports, with the June low representing a major sentiment test. On the upside, $4,700 may attract short-term selling before the market challenges $5,000.
A weekly close above $5,000 would strengthen the case for a return toward $5,300–$5,500. A brief intraday spike without follow-through would be weaker evidence because gold has already shown that record-level momentum can reverse quickly.
Risks That Could Push Gold Below $4,000
A sustained rise in real yields is the clearest macro risk. A stronger dollar, improving fiscal confidence, reduced geopolitical tension, or heavy ETF outflows could add pressure. Central-bank demand could also slow if reserve managers judge prices excessive or need liquidity elsewhere.
Technical selling may intensify if gold loses $4,200 and fails to recover quickly. Because 2026 price action has included large gaps and rapid reversals, leveraged positions face liquidation risk even when a longer-term thesis ultimately proves correct.
Is Gold Still a Good Investment?
Gold can still serve as a portfolio diversifier, reserve asset, and hedge against monetary or geopolitical instability. It is less suitable as a predictable income investment because it does not generate cash flow. Whether it is attractive depends on portfolio goals, entry price, time horizon, and tolerance for volatility.
Investors comparing XAU/USD, physical bullion, ETFs, futures, and tokenized gold should examine custody, liquidity, fees, tracking differences, and counterparty exposure. The same gold-price view can produce different results through different instruments.
Conclusion
$5,000 is not an untested fantasy target; it is the psychological level gold must reclaim after its sharp 2026 correction. Central-bank purchases, geopolitical risk, ETF inflows, and lower real yields could support another attempt. Higher real rates, dollar strength, and fading safe-haven demand remain the principal obstacles. The base-case path points to gradual appreciation through 2030, but the wide gap between bear and bull scenarios reflects genuine macro uncertainty.
FAQ
Can gold reach $5,000 again in 2026?
Yes. From around $4,600, the required move is less than 10%, but a lasting breakout probably needs lower real yields, renewed ETF inflows, or stronger geopolitical demand.
What is the XAU/USD forecast for 2030?
The scenario range used here is $4,200 in the bear case, $5,400 in the base case, and $6,800 in the bull case.
Why do higher real yields hurt gold?
Higher real yields raise the return available from inflation-adjusted bonds, increasing the opportunity cost of holding gold, which pays no interest.
Is XAUT the same as XAU/USD?
No. XAUT is a tokenized gold asset, while XAU/USD is the spot gold price quoted against the US dollar. Their prices may track closely but their market structures and risks differ.


