
The KORU stock price closed at $20.49 on August 26, 2026, according to Direxion. That was about 19.1% above its July 27 close of $17.21. The headline gain looks strong, but it hides the real story: KORU traded between an intramonth low near $11.65 and a high near $25.34.
In other words, traders who were right about the final direction still had to survive a remarkably violent path. Because KORU seeks three times the daily movement of a Korean equity benchmark, volatility is not background noise. It is part of the product.
KORU Stock Price Today
Direxion reported an August 26 net asset value of $20.47 and a market close of $20.49, leaving a small $0.02 premium. The fund fell 1.63% during that session. Prices must be refreshed before publication or trading because KORU can move quickly when Korean equities, the won or global chip sentiment changes.
KORU is the Direxion Daily MSCI South Korea Bull 3X ETF, not a company stock. Readers who need the mechanism and split history can start with Tapbit Learn’s separate What Is KORU Stock? guide.
KORU’s One-Month Price Performance
KORU closed at $17.21 on July 27, then fell to an intraday low near $11.65 on July 29. It later recovered through the high teens and low $20s, reaching an intraday high near $25.34 on August 17 before closing August 26 at $20.49.
| One-Month Reference | Price or Move | What It Shows |
|---|---|---|
| July 27 close | $17.21 | Starting reference |
| Intramonth low | $11.65 | Severe downside path risk |
| Intramonth high | $25.34 | Powerful leveraged rebound |
| August 26 close | $20.49 | About +19.1% from July 27 |
The high-to-low move was roughly negative 54%, while the low-to-August-26 rebound was about 76%. Those percentages explain KORU better than the final 19% gain. A stop, liquidation price or oversized position could have ended the trade long before the monthly result turned positive.
All figures are split-adjusted. KORU completed a 20-for-1 forward split in July 2026, so unadjusted comparisons with earlier prices can create a fake crash.
What Drove KORU Over the Past Month?
Korean Semiconductors and Nvidia
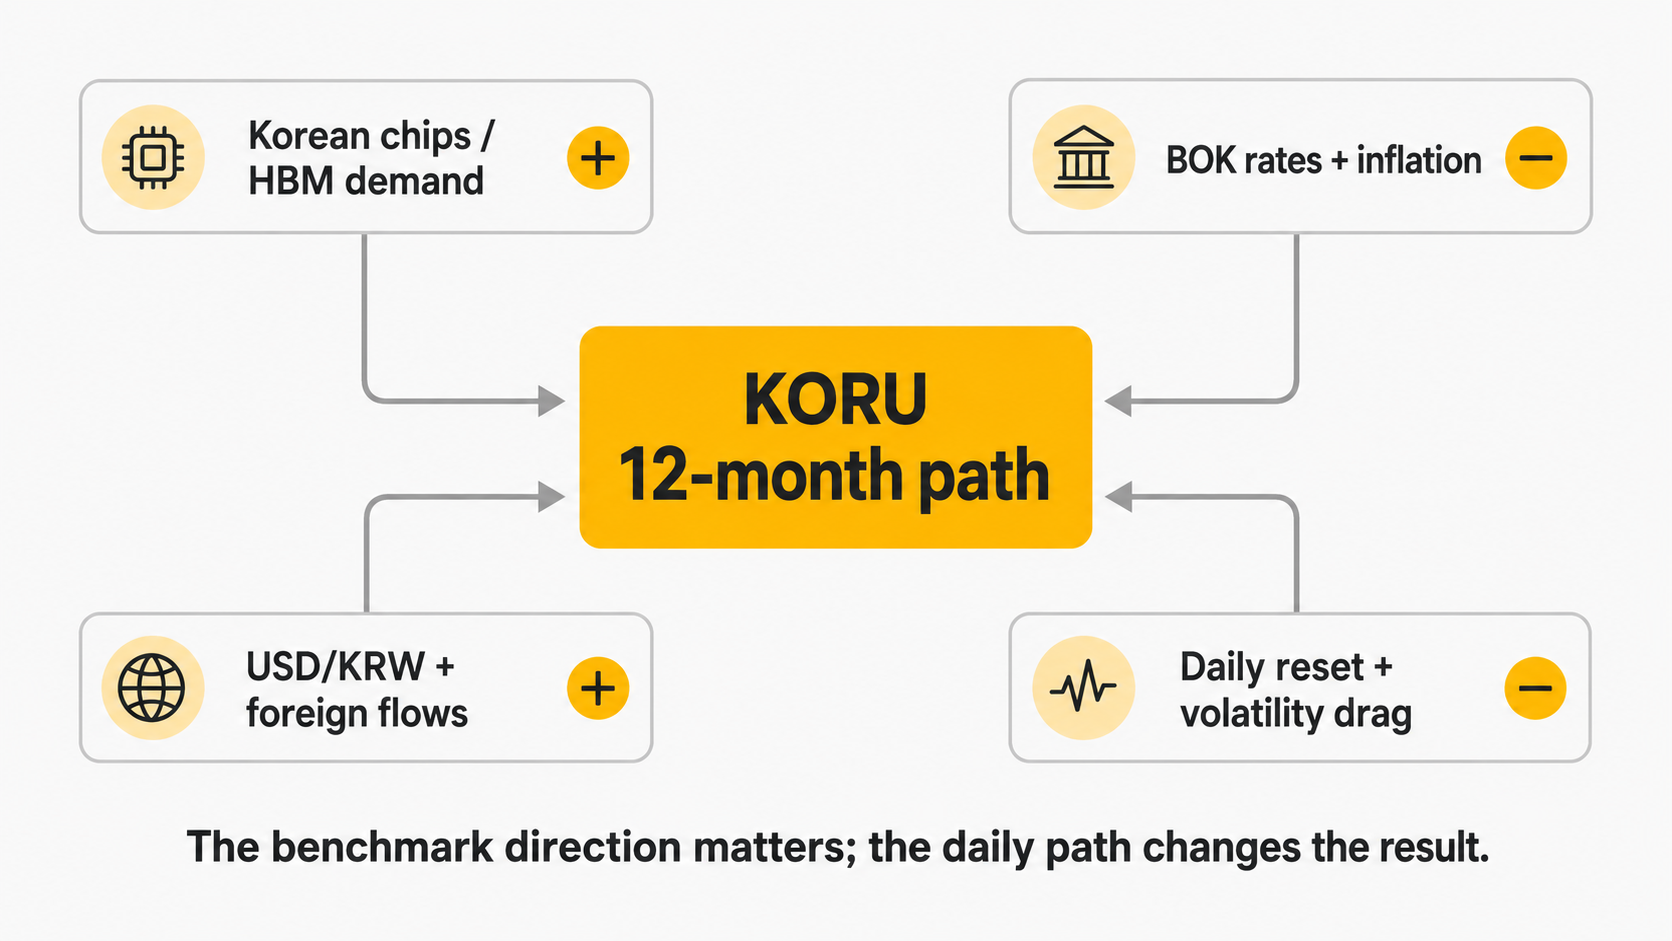
SK Hynix and Samsung Electronics carry major weight in Korean equity benchmarks. Nvidia’s strong AI demand, HBM requirements and data-center outlook can lift the broader Korean chip narrative. Nvidia’s Q2 FY2027 results reinforced that link: Data Center revenue reached $89 billion and management guided Q3 revenue to $108 billion, plus or minus 2%.
Bank of Korea Policy
The Bank of Korea raised its Base Rate to 2.75% in July and to 3.00% on August 27. Higher rates can pressure equity valuations and domestic demand, but the BOK also upgraded its growth outlook because exports, investment and semiconductors remain strong. That mixed signal helps explain why Korean stocks can rally even during a tightening cycle.
The Won and Global Risk Sentiment
A stable or stronger won can support foreign demand for Korean assets, while sharp currency weakness can increase capital-flow concern. Energy prices, Middle East risk, U.S. yields and global technology sentiment also matter because South Korea is a highly export-sensitive market.
Daily Reset and Volatility Drag
KORU resets its 3x objective every day. Strong trends can produce favorable compounding, but repeated reversals can erode value. A 12-month forecast therefore cannot simply take a KOSPI target and multiply it by three.
KORU Support, Resistance and Risk Zones
The first provisional support area is around $17–$18, close to the late-July starting zone and several August trading levels. Below that, $14–$15 becomes a deeper stress area, followed by the $11.65 monthly low.
Initial resistance sits around $21–$22. A sustained close above that range would bring $24–$25.34 back into focus. Confirmation should come from Korean benchmark breadth and chip leaders; a KORU breakout without support from its underlying market may fail quickly.
KORU 12-Month Bull, Base and Bear Forecast
| Scenario | Provisional Range | Conditions | Invalidation |
|---|---|---|---|
| Bull | $31–$49 | Orderly Korea rally, strong HBM earnings, stable won and a peak in BOK tightening | Korean benchmark trend breaks and volatility rises without net progress |
| Base | $13–$28 | Korean equities remain broadly range-bound while growth and high rates offset each other | Clean break below $11.65 or sustained breakout above $28 |
| Bear | $3–$12 | Korea benchmark drops 15%–25%, AI cycle cools or repeated drawdowns create severe decay | Korean chips recover and KORU reclaims $17–$18 |
These wide ranges are deliberate. In a daily leveraged ETF, the same benchmark return can lead to different KORU outcomes depending on the sequence and volatility of daily moves. The bull case needs a trend, not just a higher endpoint. The bear case does not require every Korean company to fail; repeated sharp declines and rebounds can damage KORU through compounding.
What Traders Should Watch Next
- SK Hynix and Samsung Electronics earnings, HBM demand and memory pricing.
- Nvidia guidance and the durability of global AI infrastructure spending.
- BOK inflation, GDP forecasts and the timing of any further rate increase.
- USD/KRW and foreign flows into Korean equities.
- KORU volume, NAV premium or discount and realized volatility.
Tapbit Learn’s AI chip stock overview provides more context on the Nvidia–Samsung–SK Hynix relationship.
How to Trade KORU-USDT Futures on Tapbit
Tapbit offers the KORU-USDT perpetual futures contract. It provides KORU-linked price exposure but does not provide ETF shares or distributions.
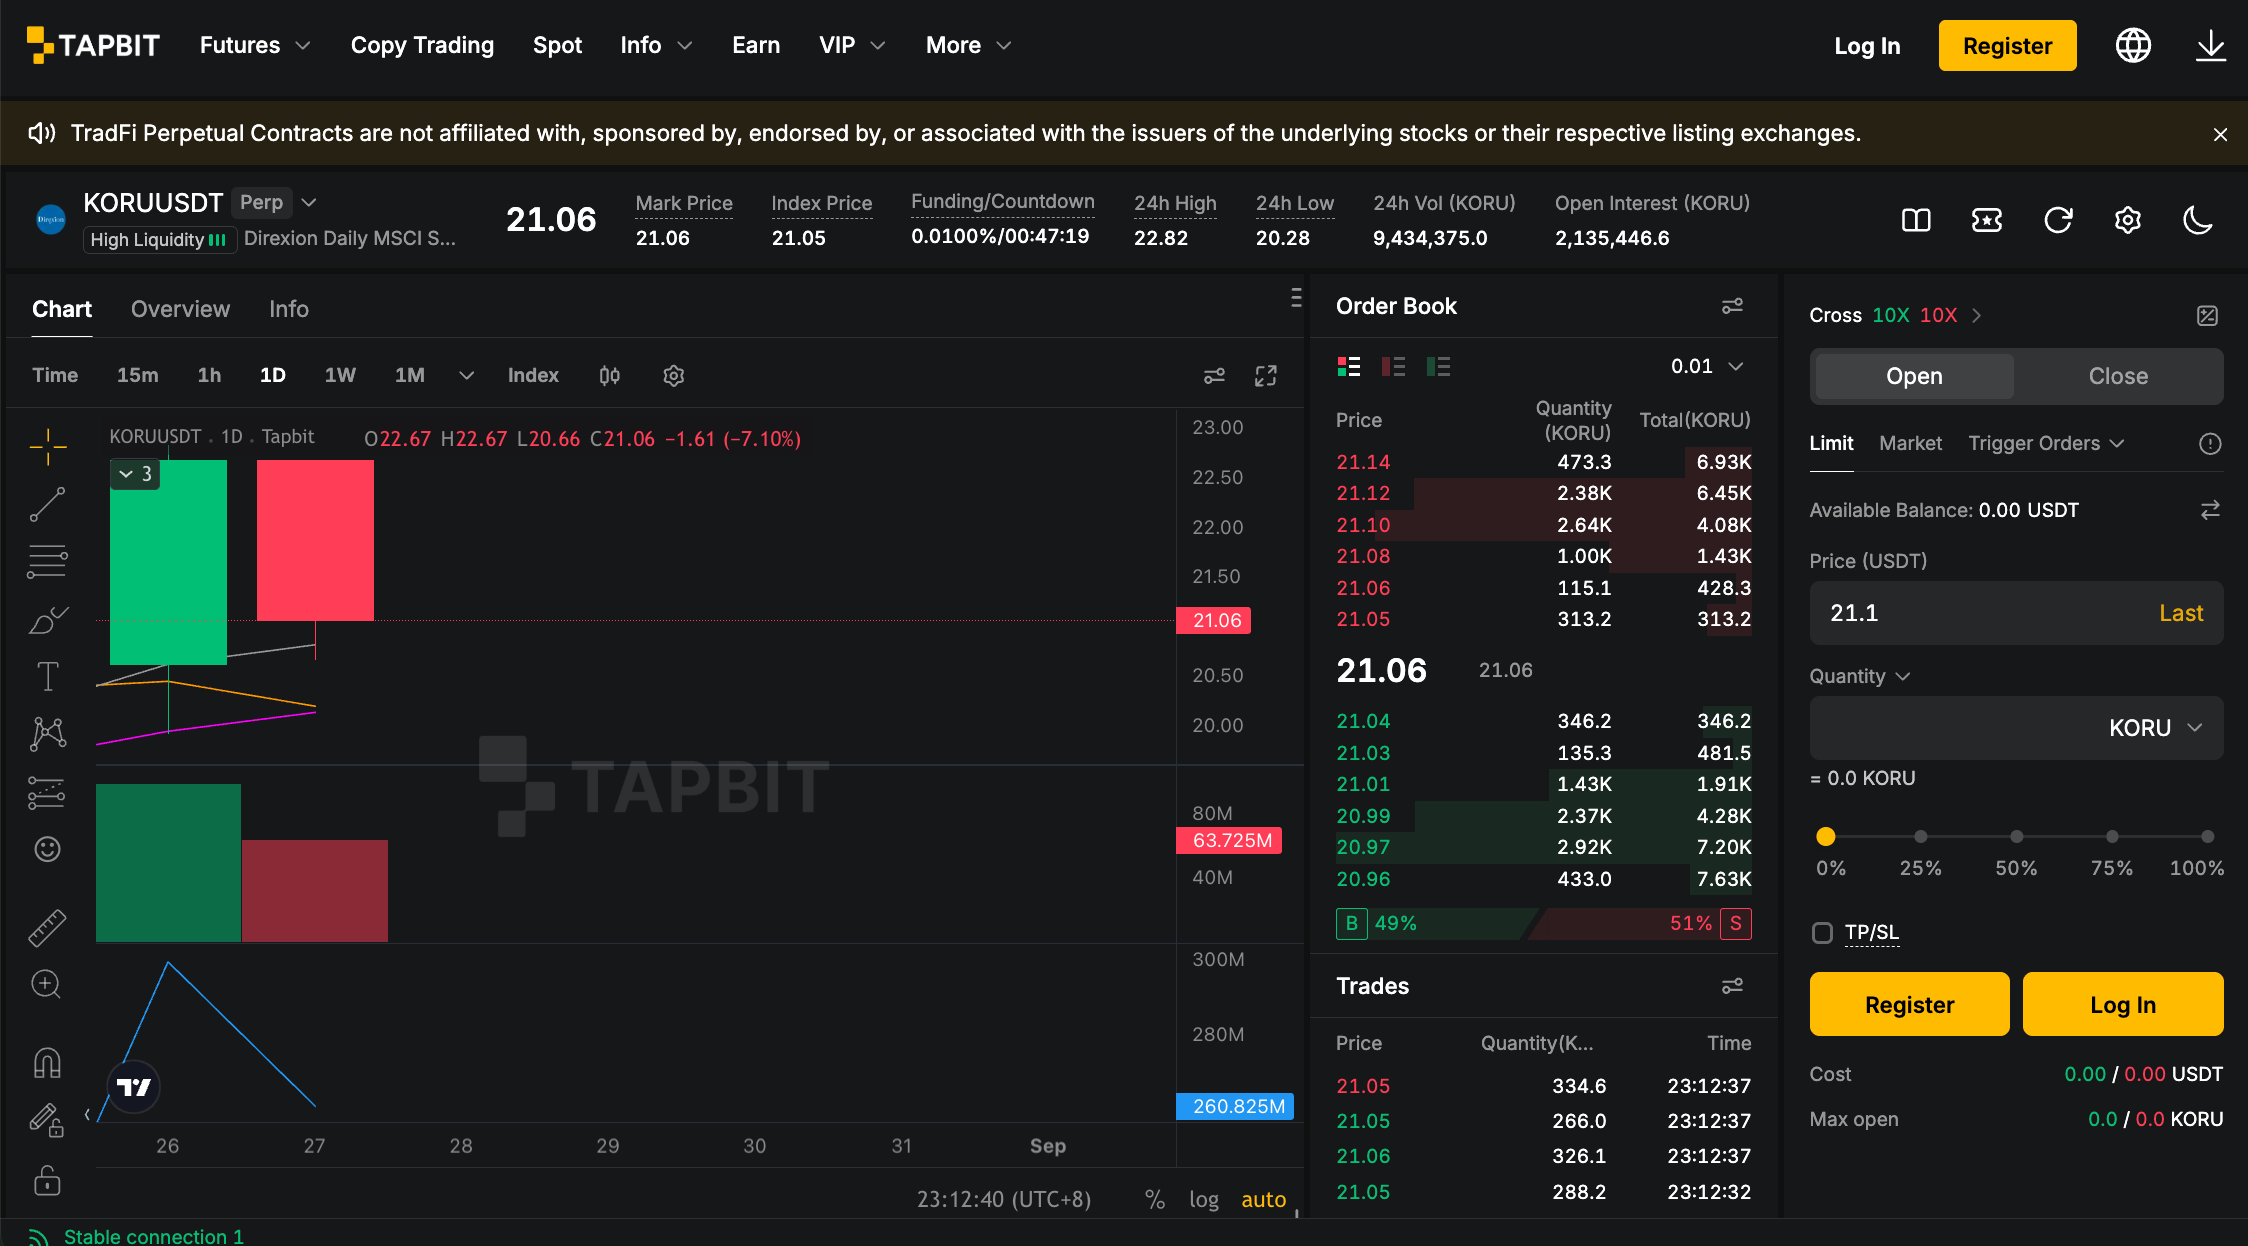
KORU already contains daily leverage, and futures margin can add another leverage layer. Check the mark price, margin mode, funding rate, stop level and liquidation price before opening a position. Traders can create an account and review the product rules first. A small position with a clear invalidation level is usually easier to manage than a large position built around one confident forecast.
Bottom Line
KORU gained about 19% from July 27 to August 26, but that result came through a range wide enough to punish both bulls and bears. Korean chips, BOK policy and the won will shape the next year. Daily reset mechanics will decide how much of that market direction KORU actually captures.
FAQ
What is the KORU stock price today?
KORU closed at $20.49 on August 26, 2026, according to Direxion. Check the live market before trading.
How much did KORU move in the past month?
It rose about 19.1% from the July 27 close to August 26, but traded between roughly $11.65 and $25.34 during the period.
Can KORU rise above $25 again?
Yes, but a durable move should be supported by Korean chip leaders, broad index strength and improving macro conditions. A brief intraday move alone is weaker confirmation.
Are the 12-month KORU ranges guaranteed?
No. They are conditional scenarios designed to show possible outcomes and the conditions that would support or invalidate them.


