

The Relative Strength Index, or RSI, is a momentum indicator that helps crypto traders judge how quickly and strongly price has moved. It ranges from 0 to 100. Readings above 70 are commonly described as overbought, while readings below 30 are commonly described as oversold.
Those labels are not automatic trade instructions. A cryptocurrency can remain overbought during a powerful uptrend or oversold during a prolonged decline. RSI is most useful when it is read in the context of trend, support and resistance, volume, and the timeframe being traded. Beginners who want to practise reading indicators can create a Tapbit account and compare RSI signals with live market structure.
What Is RSI in Crypto Trading?
RSI was developed as a way to compare the size of recent gains with the size of recent losses. Most charting platforms use a 14-period setting by default. On a daily chart, that normally means 14 daily candles; on a one-hour chart, it means 14 hourly candles.
The indicator rises when recent gains become stronger relative to recent losses and falls when selling momentum dominates. Because the result is normalized between 0 and 100, traders can compare momentum across different assets and timeframes more easily than by looking at raw price changes alone.
How Is RSI Calculated?
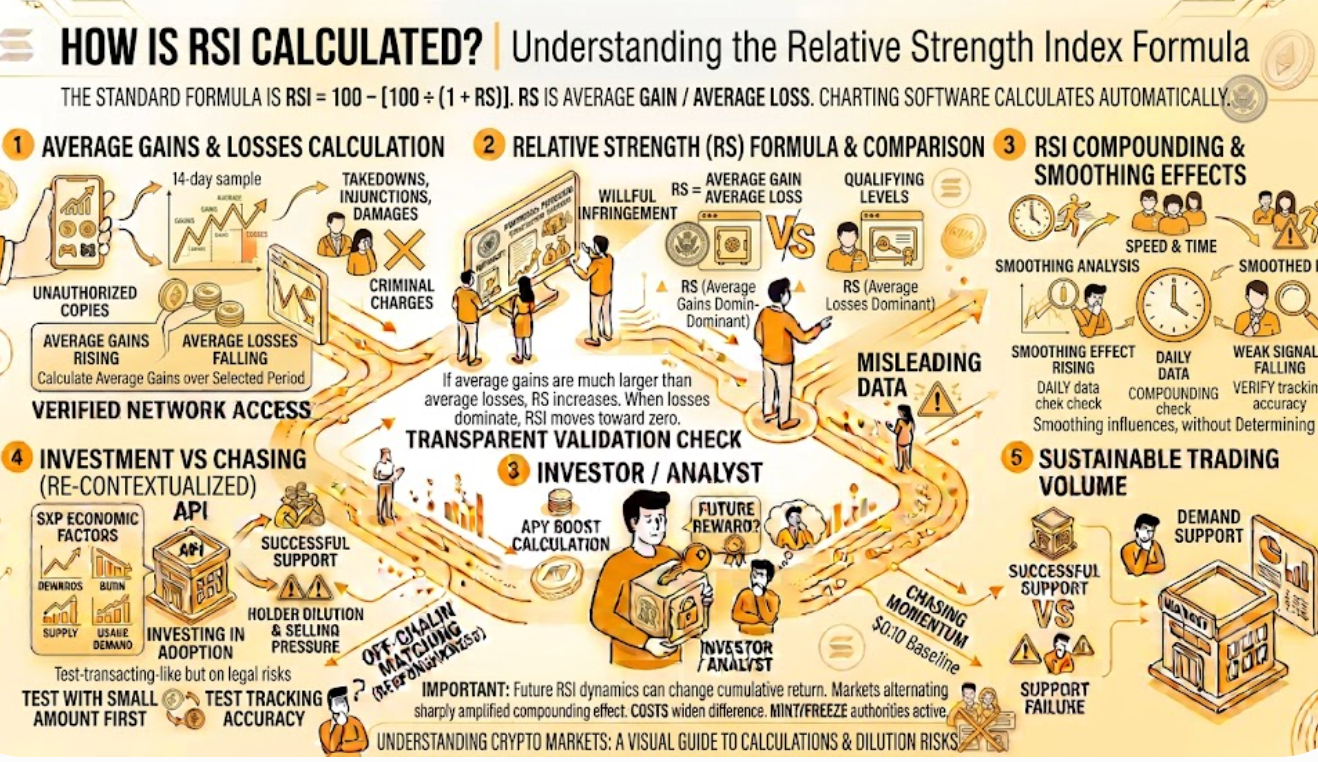
The standard formula is RSI = 100 − [100 ÷ (1 + RS)]. RS is the average gain over the selected period divided by the average loss. Charting software performs the calculation automatically, but understanding the logic helps prevent common mistakes.
If average gains are much larger than average losses, RS increases and RSI moves toward 100. When average losses dominate, RSI moves toward zero. The calculation also uses smoothing, so one unusually large candle can influence RSI without completely determining the reading.
How to Read Overbought and Oversold Signals
| RSI range | Common interpretation | What traders should check |
|---|---|---|
| Above 70 | Overbought or strong bullish momentum | Trend strength, resistance and bearish divergence |
| 50-70 | Bullish momentum | Whether pullbacks hold above the midpoint |
| 30-50 | Bearish momentum | Whether rallies fail below the midpoint |
| Below 30 | Oversold or strong bearish momentum | Support, capitulation volume and bullish divergence |
An overbought reading means price has risen quickly relative to recent history. It may precede a pullback, but it can also confirm that buyers are in control. In strong bull markets, traders sometimes adjust the upper threshold to 80 and treat the 40-50 area as support.
An oversold reading shows intense recent selling. It may identify a market that is due for a bounce, yet falling assets can stay below 30 for several candles. During strong downtrends, RSI may struggle to move above 50-60 even when price briefly recovers.
Why RSI Can Stay Overbought or Oversold
Momentum indicators describe the current rate of movement; they do not impose a limit on price. When a major catalyst, breakout or liquidation cascade creates persistent demand, RSI can remain above 70 while price continues climbing. Selling solely because the indicator is overbought can therefore mean exiting a trend too early.
The reverse applies in a crash. RSI below 30 does not guarantee that sellers are finished. A weak market can continue falling as stop-losses, liquidations and declining liquidity reinforce one another. Traders normally look for evidence that price is stabilizing before acting on the oscillator.
RSI Divergence Explained
Divergence occurs when price and RSI move in different directions. A bearish divergence forms when price reaches a higher high while RSI makes a lower high. This suggests that upward momentum is weakening, even though price has not yet reversed.
A bullish divergence appears when price records a lower low but RSI creates a higher low. Selling pressure may be fading, but the pattern remains a warning rather than confirmation. A break of market structure, a reclaim of support or expanding buy volume can provide stronger evidence that a reversal is beginning.
How Traders Use the RSI Midpoint
The 50 level is often more useful than the familiar 70 and 30 thresholds. RSI holding above 50 can indicate that average gains are stronger than average losses, supporting a bullish trend. Repeated rejection below 50 may show that bears still control momentum.
Some traders use the midpoint as a trend filter. They consider long setups when RSI is above 50 and short setups when it is below 50, then use price structure to choose entries. This approach avoids treating every extreme reading as a reversal signal.
Using RSI Across Multiple Timeframes
An RSI signal changes with the chart interval. A cryptocurrency may be oversold on a 15-minute chart while remaining bullish on the daily chart. The shorter reading may describe a temporary pullback rather than a change in the broader trend.
A practical approach starts with the higher timeframe to identify direction, then uses a lower timeframe for timing. For example, a trader may prefer oversold hourly signals when daily RSI remains above 50 and price is testing established support. Conflicting timeframes call for smaller positions or patience.
Common RSI Mistakes
The biggest mistake is buying every reading below 30 and selling every reading above 70. Another is changing indicator settings until past trades look perfect. Shorter settings react faster but produce more noise, while longer settings are smoother but slower.
RSI should not replace risk management. Indicators can fail during news events, thin liquidity or strong trends. Traders should define invalidation levels, position size and exit rules before entering, especially when futures leverage can turn a routine price move into liquidation.
A Simple RSI Trading Framework
First identify whether price is trending or ranging. Next mark important support and resistance. Then examine RSI for an extreme reading, a midpoint reclaim or divergence that agrees with those levels. Finally, wait for price confirmation rather than entering because of the indicator alone.
In a range, RSI extremes can help identify possible reversals near the boundaries. In a trend, pullbacks toward 40-50 during an uptrend or rallies toward 50-60 during a downtrend may provide more useful information than waiting for 30 or 70.
Conclusion
RSI is a straightforward way to measure crypto market momentum, but its value comes from interpretation rather than the number alone. Above 70 signals strong upward momentum and below 30 signals strong downward momentum; neither guarantees a reversal. Combining RSI with trend, structure, volume and multiple timeframes gives traders a more reliable framework for reading overbought and oversold conditions.
FAQ
What is the best RSI setting for crypto?
The 14-period setting is the common starting point. Shorter settings are more responsive, while longer settings produce smoother signals.
Is RSI below 30 always a buy signal?
No. It shows strong recent selling, but price can continue falling. Traders usually wait for support or reversal confirmation.
Should traders sell when RSI rises above 70?
Not automatically. RSI can stay above 70 during a strong uptrend. Price structure and momentum changes matter more than the threshold alone.
What is RSI divergence?
Divergence occurs when price and RSI move in different directions, potentially warning that momentum is weakening.
Does RSI work for crypto futures?
Yes, but leverage and liquidation risk make confirmation and position sizing especially important.


