

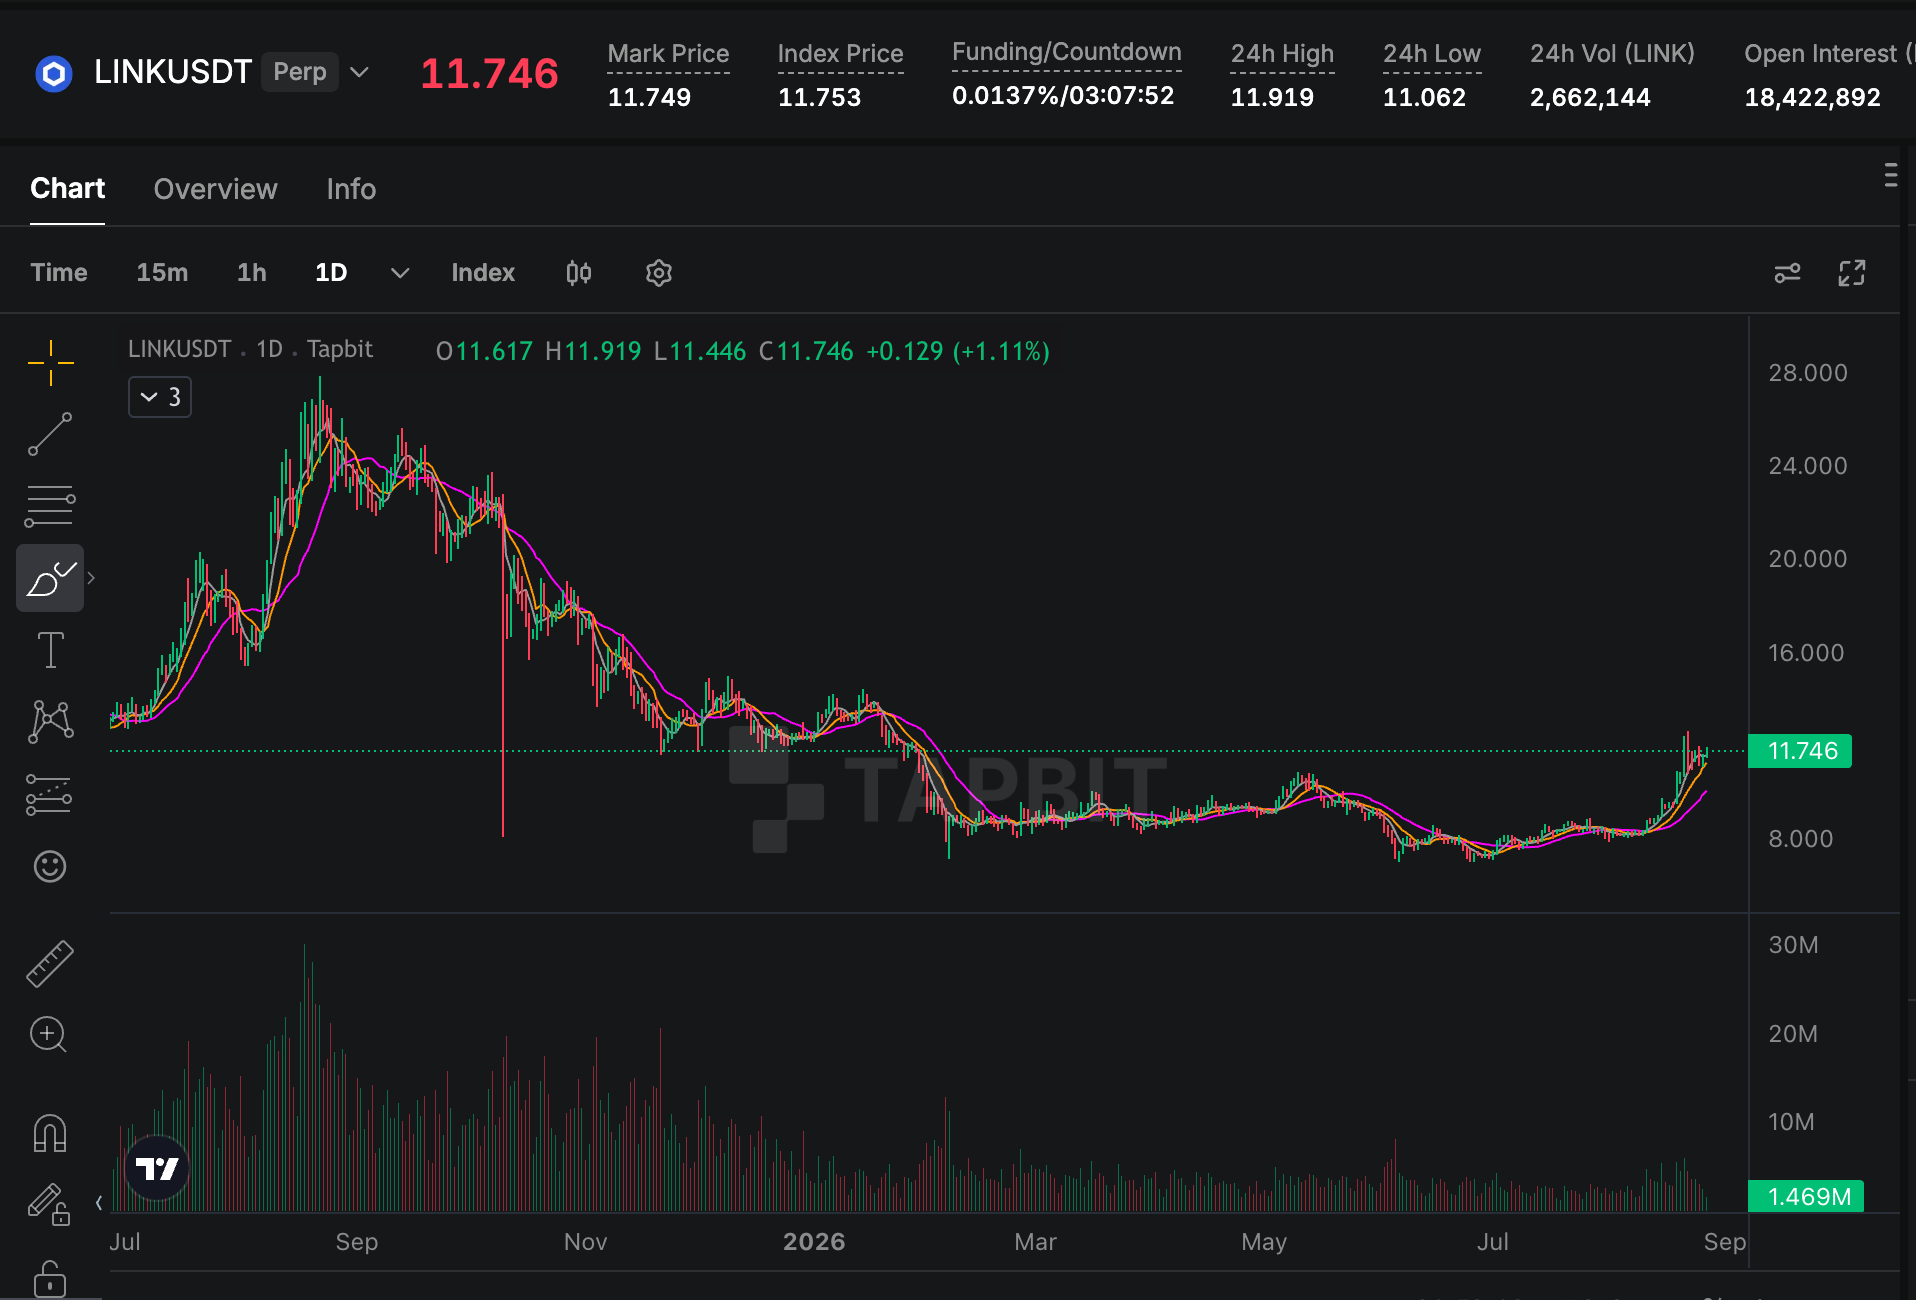
LINK/USDT has returned to a decisive futures trading zone after a sharp recovery from the $8 area. In the supplied Tapbit market snapshot, the perpetual contract traded near $11.75, with a 24-hour range of $11.06 to $11.92, positive funding of 0.0137%, and open interest of roughly 18.4 million LINK. The rebound is constructive, but the same data show why a crowded long trade could become vulnerable before LINK reaches $15.
Traders can monitor price, funding, and order execution through LINK/USDT futures on Tapbit. Futures use leverage and can liquidate positions during fast moves, so the analysis below focuses on conditional levels rather than a guaranteed direction.
LINK/USDT Futures Market Snapshot
| Indicator | Snapshot | What It Suggests |
|---|---|---|
| LINK price | About $11.75 | Testing a resistance area after a strong rebound |
| 24-hour range | $11.06–$11.92 | Elevated short-term volatility |
| Funding rate | +0.0137% | Long positions were paying shorts |
| Open interest | About 18.4M LINK | Substantial leveraged exposure remains open |
These figures describe one market snapshot, not a permanent condition. Funding, open interest, and price can change quickly. What matters is how they move together: rising price with controlled funding is healthier than rising price accompanied by rapidly expanding leverage and increasingly expensive long positioning.
What the LINK Price Chart Shows
The daily chart shows a long decline from the 2025 highs, followed by months of base-building around $8–$9. LINK then accelerated upward in August, reclaiming short-term moving averages and approaching $12. The recovery changed short-term momentum, but it has not yet erased the broader sequence of lower highs visible on the long-range chart.
Why a Long Squeeze Is a Real Risk
A long squeeze occurs when price falls into leveraged long positions, triggering stop-loss orders and liquidations. Those forced sales create additional downward pressure, which can liquidate more traders. The process can be fast even when the underlying asset’s long-term fundamentals have not changed.
Positive funding alone does not prove that a squeeze is imminent. It does show that bullish positioning carries a recurring cost. The risk becomes more serious if funding rises while price repeatedly fails below resistance, open interest stays elevated, and spot buying volume weakens.
Where Could a LINK Long Squeeze Begin?
The first warning area is $11.40–$11.50, close to the lower part of the recent breakout zone. Losing that level would put $11.00 and $10.80 in focus. A decisive daily close below $10.80 could signal that the August move has lost momentum and expose the $10.00 psychological level.
The deeper support region lies around $9.20–$9.50, followed by the previous base near $8.00–$8.50. A return to those levels is not the base case while LINK remains above $11, but leveraged traders should understand that a 10% spot decline can have a much larger effect on high-leverage futures positions.
What Would Confirm a Breakout?
Bulls need more than a brief move above $12. A stronger signal would be a daily close above the $12.00–$12.20 region, followed by a successful retest that holds as support. Volume should remain firm, while funding should avoid becoming excessively positive.
If LINK clears the immediate barrier, the next resistance zone sits around $12.80–$13.20. That area may attract profit-taking because it overlaps with earlier congestion on the chart. Converting it into support would improve the probability of a move toward $13.50 and then $15.
Can LINK/USDT Reach $15?
From $11.75, a move to $15 requires an advance of roughly 28%. That is large but possible for an altcoin during a strong market phase. The target becomes more credible if Bitcoin and the wider crypto market remain stable, LINK attracts spot-led demand, and open interest expands without extreme funding.
A direct vertical move is less healthy than a breakout followed by consolidation. If price rises while funding spikes and open interest grows much faster than spot volume, the chance of a liquidation-driven reversal increases. The route to $15 therefore matters as much as the target itself.
Bull, Base and Bear Scenarios
| Scenario | Confirmation | Potential Zone |
|---|---|---|
| Bull case | Daily close above $12.20 and support retest | $13.50–$15.00 |
| Base case | Price holds $10.80 but remains below $12.50 | $10.80–$12.80 range |
| Bear case | Loss of $10.80 with liquidations and weak volume | $9.20–$10.00 |
These are technical scenarios rather than forecasts with fixed probabilities. A macro shock, exchange-wide deleveraging event, Chainlink-specific announcement, or broad altcoin rotation could move price beyond the listed zones.
How to Read Funding and Open Interest Together
Funding shows which side of the perpetual market is paying to maintain positions. Positive funding usually means longs pay shorts; negative funding reverses that relationship. Open interest measures outstanding derivatives exposure, but it does not reveal whether every position is bullish or bearish.
Rising price and rising open interest can indicate new participation. If funding remains moderate, the trend may be sustainable. If price stalls while open interest and funding climb, leverage may be accumulating without enough spot demand. Falling price with rapidly declining open interest often indicates liquidation or position closure.
Trading Levels to Watch
Near-term support sits at $11.50, $11.00, and $10.80. Resistance appears near $12.00–$12.20, followed by $12.80–$13.20. Above those levels, $13.50 is a logical checkpoint before the $15 target.
Traders should also watch whether daily volume confirms a breakout. A low-volume move above resistance can reverse quickly. Conversely, a brief drop below support followed by rapid recovery may represent a liquidity sweep rather than a genuine trend breakdown.
Conclusion
LINK/USDT has regained momentum, but the market is balanced between breakout potential and leveraged long-squeeze risk. Holding $10.80–$11.00 keeps the recovery structure intact, while a confirmed move above $12.20 would strengthen the path toward $13.50 and $15. Positive funding and substantial open interest mean traders should avoid treating the rally as risk-free. The strongest bullish signal would be a spot-supported breakout with controlled leverage, not simply a rapid increase in perpetual positioning.
FAQ
Is LINK bullish right now?
Short-term momentum is bullish while price holds above the recent breakout zone, but resistance around $12.00–$12.20 still needs to be cleared.
What could trigger a LINK long squeeze?
A rejection below resistance followed by a loss of $11.40, especially with elevated open interest and positive funding, could force leveraged longs to close.
Can LINK reach $15?
Yes, but the setup becomes stronger only after LINK closes above immediate resistance and holds the breakout. The move requires roughly a 28% gain from $11.75.
What is the main LINK/USDT support?
The first major support area is $10.80–$11.00. Below it, traders may focus on $10.00 and $9.20–$9.50.


