

HYPE/USDT is trading near $80 after a steep rebound, while the supplied Tapbit futures snapshot shows substantial open interest and positive funding. That combination can produce a liquidation squeeze, but it does not confirm that a squeeze is already underway. Rising open interest means more leveraged positions are entering the market; it does not show whether those positions are mostly long or short.
The immediate question is which side becomes trapped first. Traders can monitor the live HYPE/USDT perpetual futures market on Tapbit, where price, funding, volume and open interest should be read together rather than in isolation.
HYPE/USDT Futures Market Snapshot
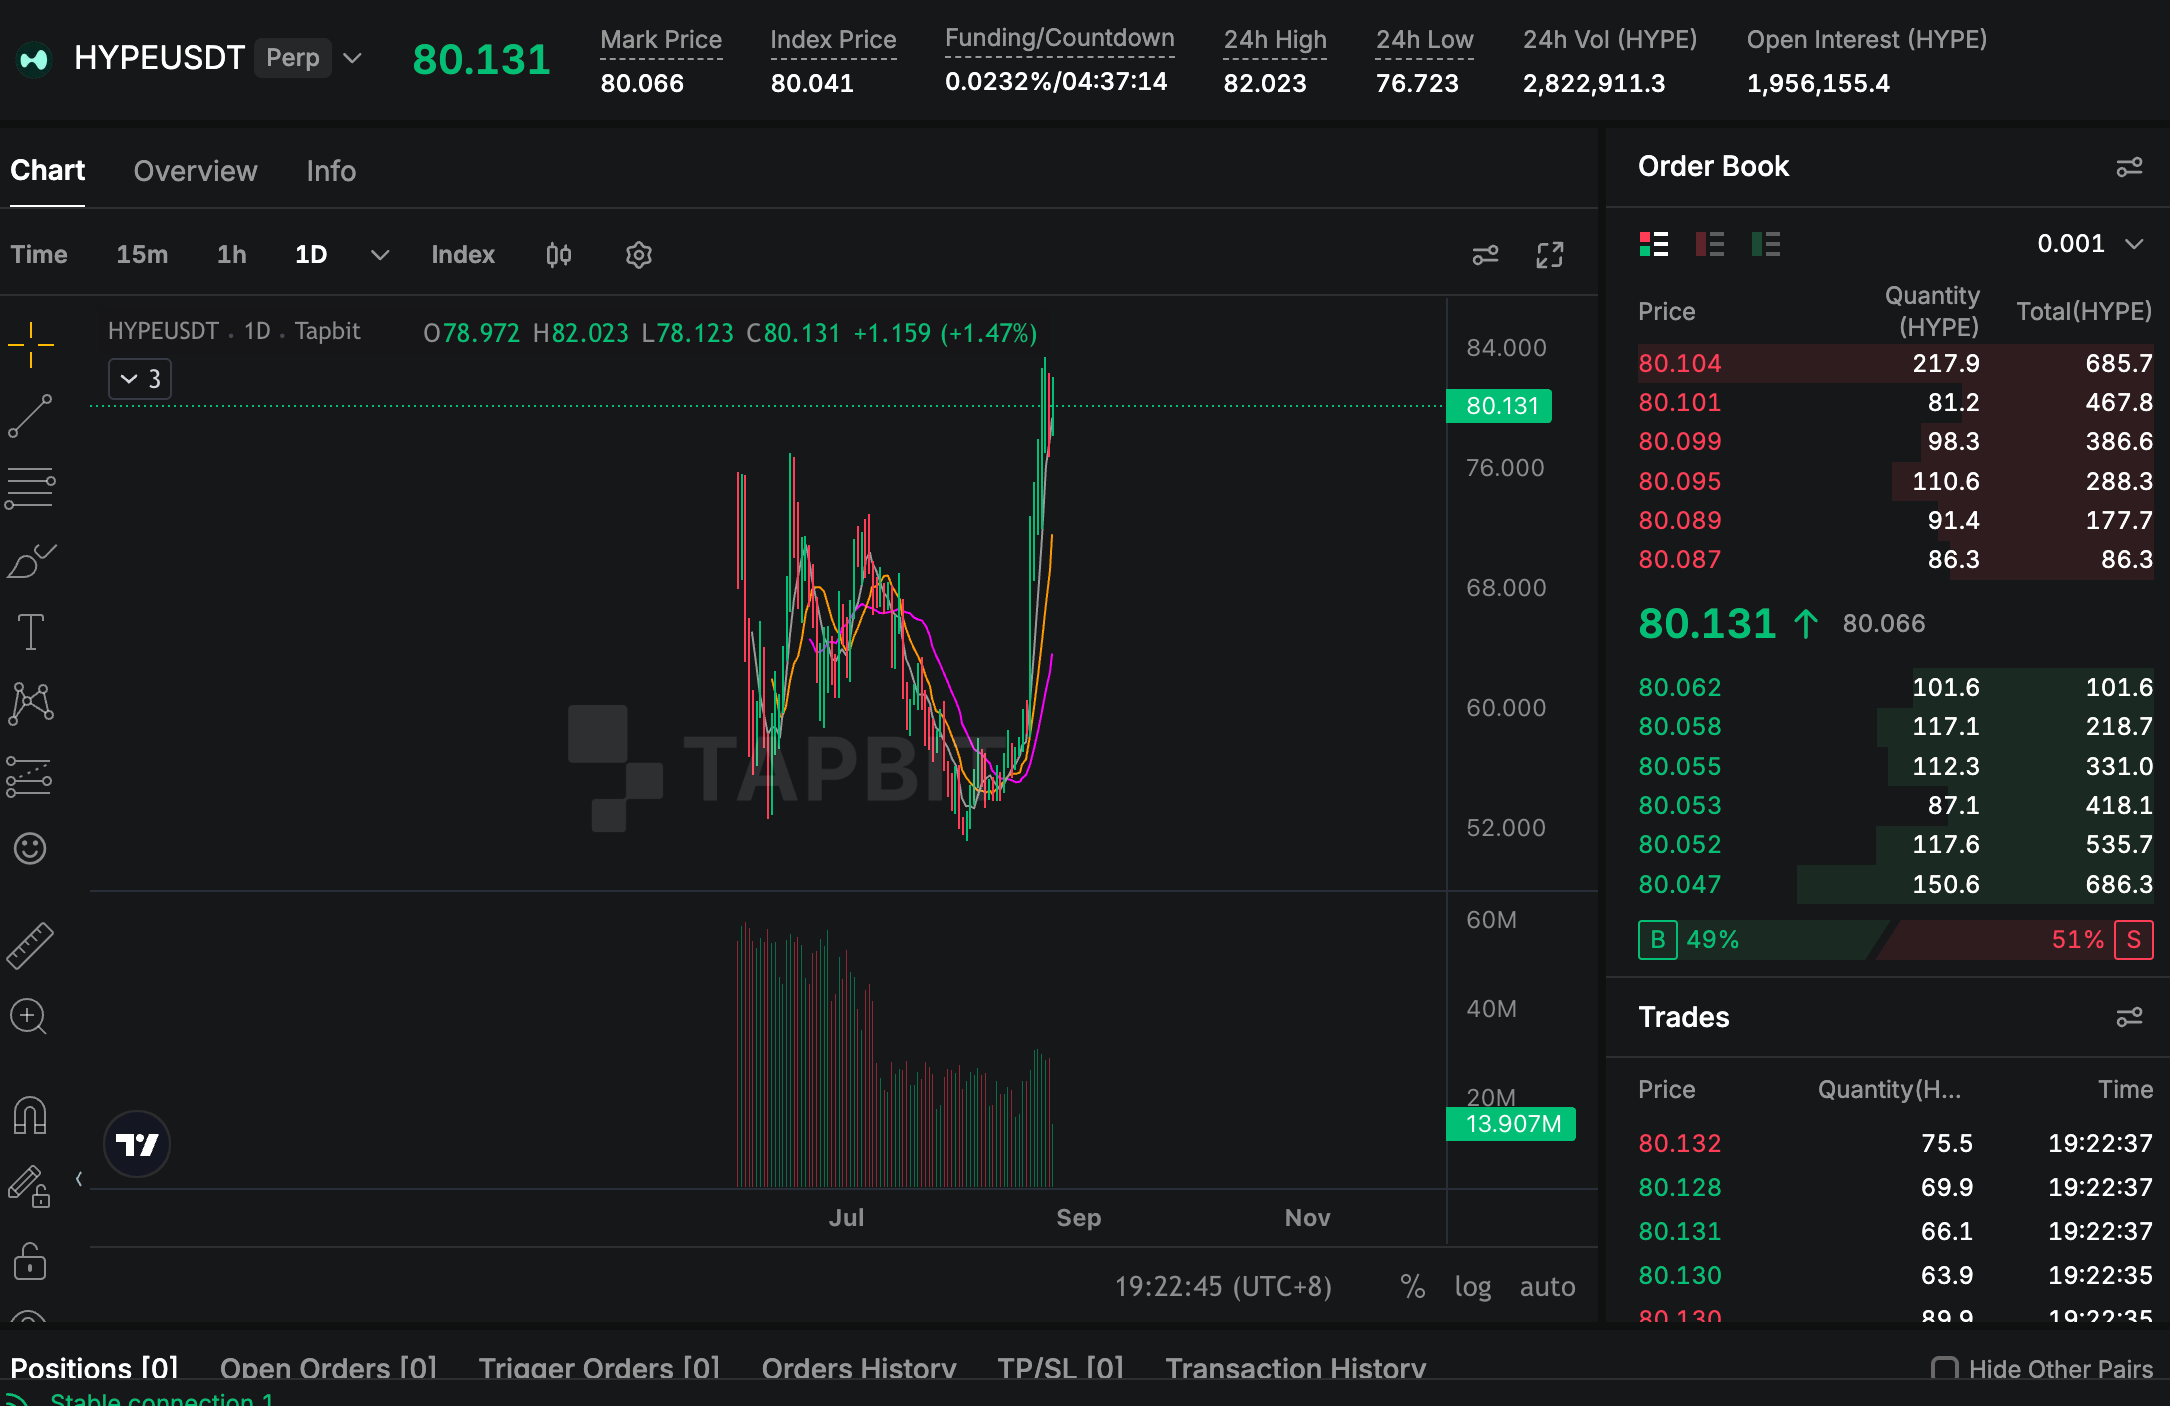
Based on the provided market snapshot, HYPE/USDT was trading around $80.131, with a mark price of $80.066 and an index price of $80.041. The 24-hour range extended from $76.723 to $82.023, while the displayed open interest was approximately 1,956,155 HYPE. The daily candle was up about 1.47% after trading as high as $82.023.
Funding was positive at 0.0232% at the time of the screenshot. Positive funding normally means long positions are paying short positions, suggesting bullish positioning is carrying a cost. The figure is a point-in-time reading, however, and can change quickly as traders close, reverse or add leverage.
What Rising Open Interest Actually Means
Open interest measures the number of outstanding futures or perpetual contracts that have not been closed. When price and open interest rise together, new positions are entering during an advance. That often confirms stronger participation, but the same setup can become unstable if leverage grows faster than spot demand.
The screenshot provides the current open-interest total, not a historical series. Confirming that open interest is rising requires comparing this reading with earlier periods. If open interest continues climbing while price stalls near resistance, the market may be building a larger pool of positions that can be liquidated when volatility returns.
Could HYPE Be Setting Up a Short Squeeze?
A short squeeze becomes more likely when price pushes through resistance while short sellers are forced to buy back contracts. For HYPE, a decisive move above the recent $82.02 high could trigger stops and liquidations from bearish positions, particularly if open interest remains elevated and trading volume expands.
Yet positive funding complicates the argument. Because longs were paying shorts in the supplied snapshot, the market may already contain aggressive bullish leverage. If price fails repeatedly at $82 while funding stays positive, the vulnerable group may be late longs rather than shorts. That could produce a long squeeze in the opposite direction.
The Two Liquidation Scenarios
| Scenario | Confirmation | Potential result |
|---|---|---|
| Short squeeze | Price closes above $82 with rising volume and open interest | Forced buying could accelerate the move toward $84-$88 |
| Long squeeze | Price loses $78 and $76.7 while funding remains positive | Long liquidations could deepen a pullback toward $72-$74 |
| Deleveraging | Open interest falls while price holds its range | Leverage resets without a major directional squeeze |
These are conditional paths, not fixed targets. Liquidation levels depend on entry price, leverage and collateral, so a single chart cannot show where every trader will be forced out.
Key HYPE Price Levels to Watch
The first resistance zone is $82-$84, covering the visible daily high and the next round-number area. A clean daily close above it would strengthen the bullish structure and make a short squeeze more plausible. Failure there would keep the market vulnerable to profit-taking after the rapid move from the low-$50 region.
On the downside, $78 is the first short-term pivot. The $76.7 area is more important because it marks the displayed 24-hour low. Below that, $72-$74 could become the next stabilization zone. A deeper move toward $68 would suggest that the breakout has lost momentum rather than merely paused.
Signals That Would Confirm a Squeeze
Price action should lead the analysis. A breakout accompanied by expanding volume and open interest is more convincing than one produced on thin activity. Traders should also watch whether funding becomes sharply positive, since increasingly expensive long exposure can signal crowding even during an apparently bullish move.
Liquidation data offers the most direct confirmation after the move begins. A surge in short liquidations during a break above $82 would support the short-squeeze thesis. Heavy long liquidations below support would confirm the opposite. Spot-market participation matters as well because a rally driven mostly by derivatives is easier to reverse.
How to Manage HYPE Futures Risk
HYPE perpetual futures can involve leverage, liquidation, funding payments, slippage and rapid changes in market depth. Using lower leverage reduces the distance between ordinary volatility and a forced liquidation. Stops should be planned around market structure rather than placed exactly at obvious round numbers where temporary wicks are common.
Traders should also avoid assuming that high open interest is automatically bullish. It describes participation, not direction. A stronger process is to compare changes in price, open interest, funding and volume over the same timeframe and reduce exposure when those signals conflict.
Conclusion
HYPE/USDT may be entering a high-volatility setup, but the available snapshot does not prove that a short squeeze is imminent. A sustained break above $82 with expanding volume, elevated open interest and visible short liquidations would strengthen that case. Rejection at resistance followed by a loss of $78-$76.7 could instead punish crowded longs. The direction of the squeeze will be decided by price confirmation, not open interest alone.
FAQ
What does HYPE open interest measure?
It measures outstanding HYPE futures or perpetual contracts that remain open. It does not reveal trader direction by itself.
Does positive funding mean HYPE will fall?
No. It means longs are paying shorts at that moment. Persistently high positive funding can indicate crowded bullish leverage, but price may continue rising.
What level could trigger a HYPE short squeeze?
The recent $82 area is the first visible resistance. A high-volume break and close above it could pressure short positions.
Can HYPE experience a long squeeze instead?
Yes. A break below $78 and $76.7 while funding remains positive could force leveraged longs to close or be liquidated.


