
Why Is Bitcoin Crashing Today?
Why is Bitcoin crashing today is the question traders are asking after BTC fell from the $70,000 area toward the mid-$60,000s on June 18, 2026. In the market snapshot used for this article, BTC traded near $66,400, with a 24H high around $70,800 and a low around $65,300.
That drop does not point to one single cause. It looks like a combination of macro pressure, profit-taking, ETF-flow caution, and leverage being cleared from the market.
This is a news-style market update, not investment advice.
BTC Price Snapshot: What Changed in 24 Hours
The short-term move matters because Bitcoin gave back a large part of its previous intraday range.
| BTC Snapshot | Approximate Level |
|---|---|
| Recent BTC area | $66,400 |
| 24H high | $70,800 |
| 24H low | $65,300 |
| Key short-term support to watch | $65,000-$66,000 |
| First recovery zone to watch | $68,000-$70,000 |
A fall from the 24H high near $70,800 to the low near $65,300 implies an intraday drawdown of roughly 7.8%. That size of move can force short-term traders to reduce exposure, especially when futures leverage is crowded.
For historical context, Tapbit Learn's why bitcoin dropping guide explains how macro pressure and positioning can combine during BTC selloffs.
Fed Pressure and Liquidity Are Back in Focus
The first driver is macro. Search results and market commentary around the move point to the Federal Reserve, liquidity expectations, and weaker risk appetite.
When the Fed sounds cautious or less dovish than traders hoped, high-beta assets can sell off together. Bitcoin often behaves like a liquidity-sensitive asset in these moments. If traders expect tighter financial conditions, they may cut crypto exposure before clearer data arrives.
This does not mean Bitcoin's long-term thesis changed overnight. It means short-term positioning can react quickly when macro expectations shift.
Tapbit Learn's crypto fear and greed index article is useful here because BTC selloffs often accelerate when sentiment flips from confidence to caution.
ETF Flows, Profit-Taking, and Leverage Added Pressure
The second driver is market structure. Bitcoin has become more connected to ETF demand, institutional flows, and derivative positioning.
Three things can pressure BTC at the same time:
- ETF-flow anxiety: If traders expect weaker inflows or fresh outflows, spot demand expectations soften.
- Profit-taking: After strong rallies, holders may sell into uncertainty rather than wait for a deeper pullback.
- Leverage flush: Futures traders using high leverage can be forced out when price moves through liquidation zones.
This is why Bitcoin can fall faster than the headline news suggests. One macro trigger can start the move, but derivatives and forced selling can extend it.
For a related institutional angle, see Tapbit Learn's coverage of Bitcoin ETF outflows.
What Happens Next for Bitcoin?
The next BTC path depends on whether buyers defend the current range or whether sell pressure continues.
Base case: BTC stabilizes between $65,000 and $68,000 while traders wait for fresh macro data and ETF-flow confirmation.
Bullish recovery case: BTC reclaims $68,000-$70,000 with stronger volume, suggesting the move was mostly a leverage reset.
Bearish continuation case: BTC loses the $65,000 area and retests deeper liquidity zones. In that scenario, traders may watch the low-$60,000s for the next major reaction.
No scenario is certain. The useful question is not only "Will Bitcoin recover?" but "Which price zones confirm buyers are returning?"
How to Trade BTC Futures on Tapbit During Volatility
Experienced users who understand leverage can monitor BTC futures on Tapbit. Futures can be used to trade both long and short views, but leverage increases risk.
Basic flow:
- Open the BTCUSDT futures market and review price, volume, funding, and order book depth.
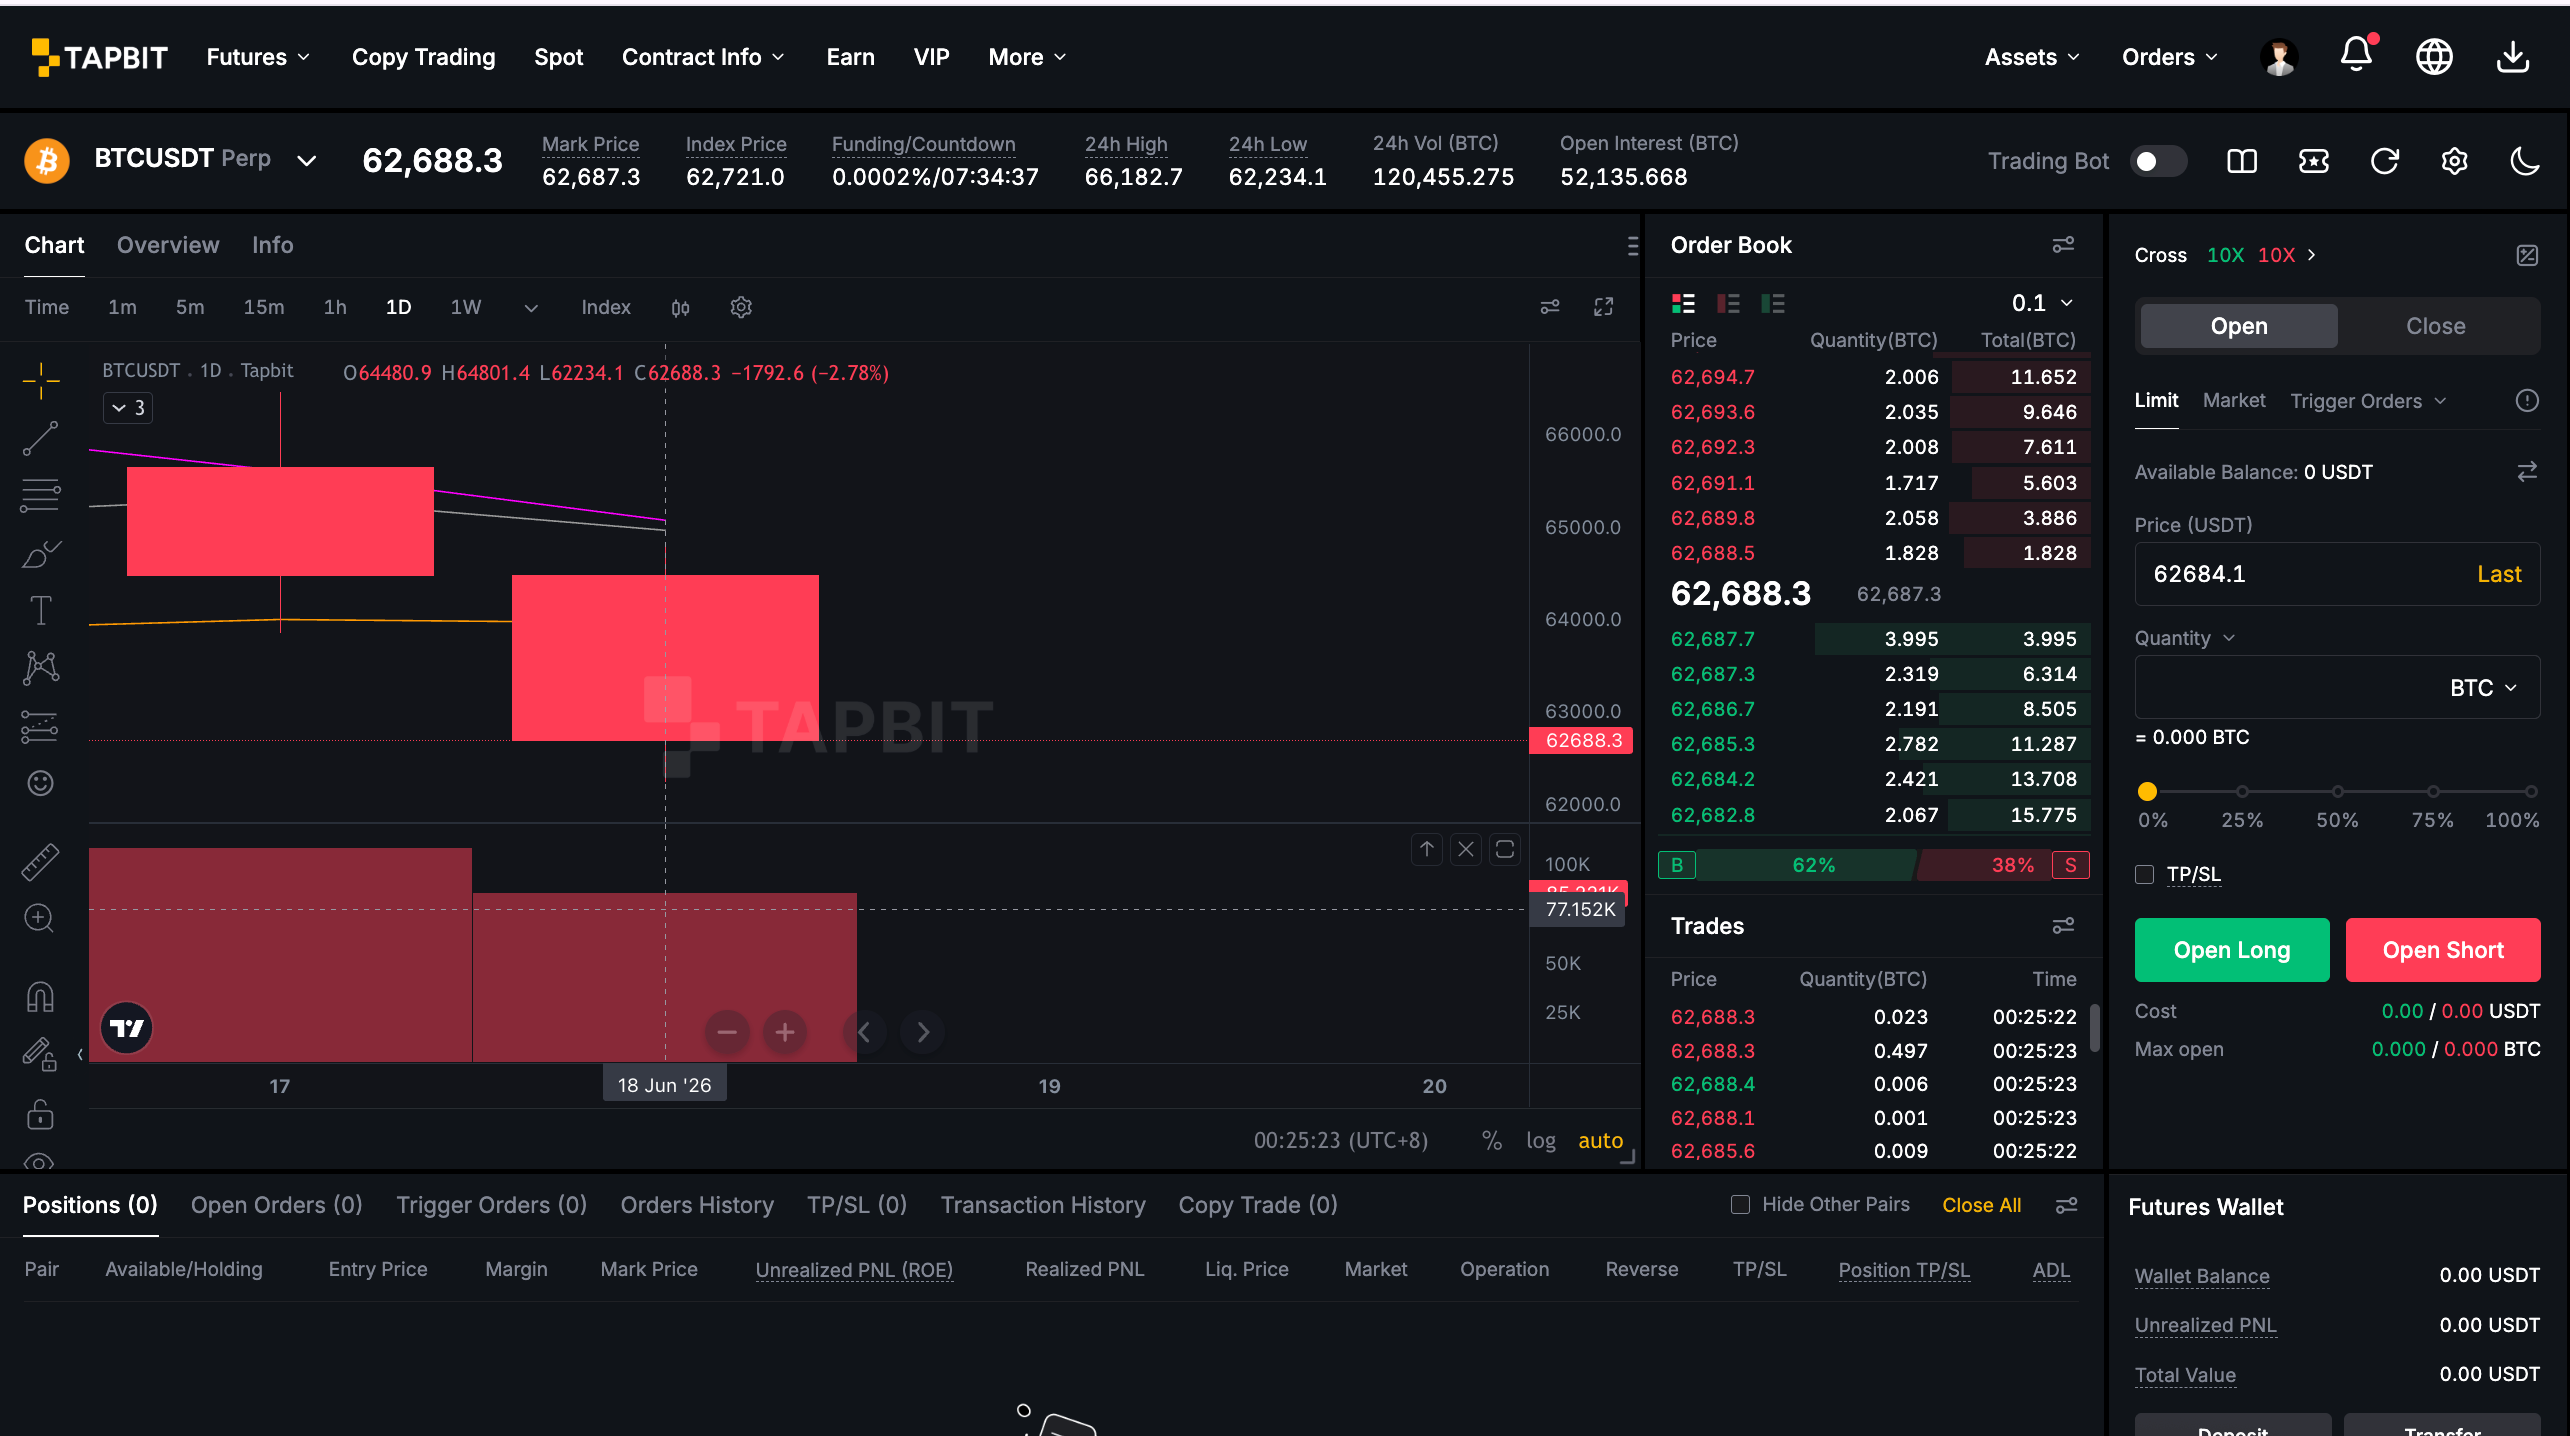
- Choose margin mode, leverage, and order type based on your risk plan.
- Set take-profit and stop-loss before opening the position.
- Reduce size when volatility is high or when key support breaks.
New users can create an account first and practice reading market data before using leverage. For cost planning, review Tapbit's trading fees.
Conclusion
Why is Bitcoin crashing on June 18, 2026? The short answer is: macro caution, liquidity worries, ETF-flow sensitivity, and leveraged selling hit at the same time. Bitcoin's move from the $70,000 area toward the mid-$60,000s shows how fast sentiment can change.
For now, traders are watching the $65,000-$66,000 zone for support and $68,000-$70,000 for recovery confirmation. If BTC cannot hold support, the market may look for lower liquidity before a stronger rebound attempt.
FAQ
Why is Bitcoin dropping so much?
Bitcoin is dropping because macro pressure, profit-taking, ETF-flow concerns, and futures leverage appear to be reinforcing each other.
Will Bitcoin ever go back up again?
Bitcoin can recover after selloffs, but timing depends on liquidity, demand, macro data, ETF flows, and whether buyers defend key support.
Could Bitcoin crash to $10K?
That would require an extreme market breakdown. For the current move, traders are watching nearer zones such as $65,000, $60,000, and the low-$60,000s first.
Is this a good time to trade BTC futures?
Only for users who understand leverage and risk controls. High volatility can create opportunity, but it can also cause fast losses.
What should traders watch next?
Watch BTC support near $65,000-$66,000, recovery above $68,000-$70,000, ETF-flow headlines, funding rates, and macro commentary.