
May 2026: A Market Turning Point Worth Paying Attention To
On May 6, 2026, the crypto fear and greed index touched 50 for the first time since January 17. What made that number significant was not the figure itself, but what it ended: 108 consecutive days of negative readings, including a stretch in March when the index fell as low as 14 — one of the deepest and longest extreme fear periods since 2022.
At the same time, Bitcoin was testing and attempting to hold above $81,000. Total crypto market capitalization had grown roughly 5.45% through May and was approaching $2.66 trillion. The shift from fear to neutral did not happen overnight, and it does not guarantee that greed is next. But it does signal a measurable change in the emotional structure of the market.
This is a useful moment to understand what the index actually tracks, what each zone means in practice, and how the events of early 2026 should inform how you use it going forward.

What Is the Crypto Fear and Greed Index?
The crypto fear and greed index is a composite sentiment tool that distills multiple data signals into one number between 0 and 100. A low score indicates that fear is dominant — traders are cautious, selling pressure is elevated, and prices often trade below recent averages. A high score indicates greed — optimism is running high, risk appetite is strong, and markets may be getting ahead of fundamentals.
The concept traces back to a stock market sentiment tool originally built by CNN Money, which measured how far several indicators had deviated from their norms to assign a score. The crypto version adapted this idea for digital asset markets, where emotional swings tend to be faster and more extreme than in traditional finance.
One practical detail that most introductory guides skip over: the index is not one single tool. Alternative.me, CoinMarketCap, CoinStats, Milk Road, and Binance all publish their own versions, and on any given day, those versions can differ by 10 to 20 points. The reason is straightforward — each provider uses a different set of inputs and assigns different weights to them. Alternative.me is the most widely cited reference point, so it is the version this article uses as its baseline. If you monitor the index regularly, pick one source and stick with it rather than comparing multiple platforms simultaneously.
How the Index Is Calculated
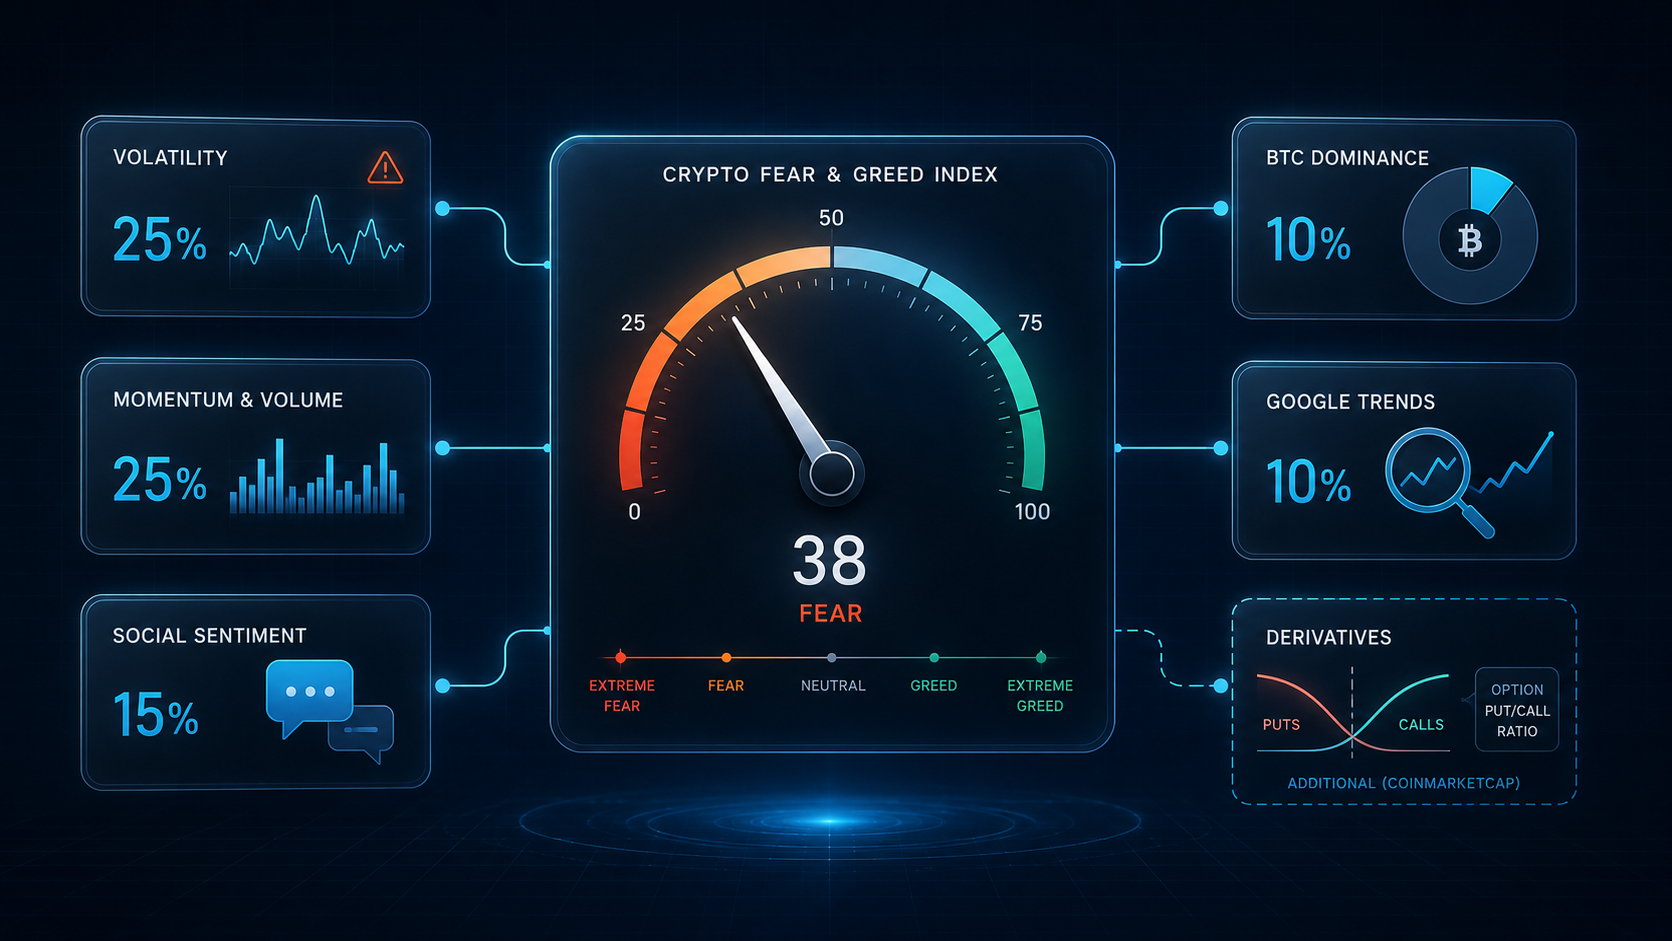
The Alternative.me index draws on five data sources, each contributing a specific share of the final score.
Volatility (25%) compares current Bitcoin price swings against the average volatility of the past 30 and 90 days. An unusual spike in volatility — the kind that happens during sharp selloffs — is treated as a sign of fear. Calmer price action is associated with more confident market behavior.
Market momentum and volume (25%) compares current buying volume against the same 30 and 90-day historical averages. Strong buying volume relative to recent norms points toward greed; weak or selling-dominated volume points toward fear.
Social media sentiment (15%) scans platforms like X (formerly Twitter) and Reddit for crypto-related posts and measures the rate of interactions. An unusually high engagement rate — lots of people talking about crypto at the same time — tends to indicate greedy or euphoric sentiment.
Bitcoin dominance (10%) measures Bitcoin's share of total crypto market capitalization. When Bitcoin dominance rises, it often means investors are moving out of riskier altcoins and into the largest asset — a defensive, fear-driven rotation. When dominance falls, it reflects greater appetite for speculative smaller coins, which tends to accompany greed.
Google Trends (10%) monitors search volume for Bitcoin and crypto-related queries. Search terms with negative connotations — like "crypto crash" or "is Bitcoin dead" — add to the fear reading. A surge in searches like "how to buy Bitcoin" tilts the index toward greed.
CoinMarketCap's version also incorporates a derivatives component — the put/call ratio in Bitcoin and Ethereum options markets — which is one reason its readings can differ from Alternative.me even on the same day.
Reading the Five Zones
The index divides into five ranges, and each one describes not just an emotional state, but a pattern of market behavior.
|
Score Range |
Zone |
What the Market Typically Looks Like |
|
0–24 |
Extreme Fear |
Forced selling, liquidation cascades, negative headlines dominate. Prices often trade well below recent highs. In March 2026, this zone lasted 38 consecutive days with the index touching 14. |
|
25–44 |
Fear |
Traders remain cautious. Rallies are sold quickly. Capital tends to concentrate in Bitcoin and stablecoins rather than smaller tokens. |
|
45–54 |
Neutral |
No clear emotional bias. Price action is mixed, and technical signals tend to be more reliable because they are less distorted by crowd emotion. This is where the index stood as of May 6, 2026. |
|
55–74 |
Greed |
Optimism builds. Dips get bought aggressively, and appetite for altcoins and leverage rises. Bitcoin hit its all-time high of $126,080 in October 2025 when the index was at 71. |
|
75–100 |
Extreme Greed |
Euphoria. Parabolic price moves, heavy leverage, speculative narratives dominate. The historical all-time high for the index was 95, recorded in June 2019. |
The ranges are reference points, not rigid rules. A reading of 75 at the start of a new bull market cycle behaves differently from a reading of 75 after an extended rally that is running out of steam. Context — price structure, macro backdrop, and where you are in the broader cycle — always matters alongside the number itself.
The Clearest Lesson From Early 2026
The events of early 2026 offer the most concrete demonstration of what the index can and cannot do.
From late January onward, the index spent 108 days in fear or extreme fear territory. During the most intense phase in March, it sat at 14 to 15 for 38 consecutive days — a sustained fear streak comparable in length to episodes seen during the 2018 and 2022 bear markets. For traders who follow the classic contrarian logic — "buy when others are fearful" — the index appeared to be signaling an opportunity for weeks.
The problem was that the index remained low while prices continued to fall. Traders who entered early based purely on the sentiment reading faced further drawdowns before any recovery materialized. Meanwhile, institutional capital told a different story: during the March extreme fear period, Bitcoin and Ethereum ETF products recorded approximately $180 million in net inflows, with professional money moving in while retail sentiment stayed deeply negative.
This reveals something important about how the index has evolved. The fear and greed index largely reflects the emotional state of retail participants — the social media posts, the Google searches, the panic-selling behavior that feeds its inputs. But in a market where billions of dollars in ETF assets are managed by institutions that use their own research and don't change behavior based on social media sentiment, the index captures only part of the picture. Prices increasingly respond to institutional flows, macro data, and ETF dynamics, none of which appear directly in the index calculation.
The practical conclusion: the index tells you where retail sentiment stands. It does not tell you where prices are going next.
How to Use the Index in the Current Neutral Environment
The neutral zone — roughly 45 to 54 — is the phase most guides say the least about, because it is less dramatic than the extremes. But for practical trading, it is arguably the most useful context to operate in.
When sentiment sits at neutral, price action is less distorted by crowd emotion. That means technical signals — support and resistance levels, volume confirmation, momentum indicators — tend to be more reliable than during periods of extreme fear or extreme greed. A clean breakout in neutral sentiment is generally a more trustworthy signal than the same breakout happening when the index reads 85 and everyone is already positioned.
Three specific applications make sense in the current May 2026 context.
Use it as a backdrop check, not a direction signal. Before entering any position, checking that the index is not at an extreme gives you confidence that market conditions are relatively balanced. In the current neutral reading, neither panic-driven support failure nor euphoria-driven overextension is distorting price discovery. That is a more stable environment for both spot trading and shorter-term decisions.
Calibrate position size and leverage, not just direction. Many experienced traders adjust how much they risk rather than simply changing which way they trade. In extreme greed, they reduce size and tighten stops. In extreme fear, they scale in gradually with smaller positions. In neutral — the current phase — they maintain their standard risk parameters and focus on chart-based entries rather than sentiment-based ones. If you are trading Bitcoin futures on Tapbit, the neutral reading supports using moderate leverage rather than running either very low or very high exposure. Review the fee structure before sizing up positions so execution costs do not quietly reduce your margin for error.
Read the direction of change, not just the current number. The index moving from 14 in March to 50 in early May is itself informative — it shows that selling pressure has meaningfully eased and that sentiment is rebuilding. But a reading of 50 reached after 108 days of fear is different from a reading of 50 reached after a decline from 80. The trajectory matters as much as the current figure. Track the live Bitcoin price alongside the index to see whether price behavior is confirming the sentiment shift or lagging behind it.
If you are newer to reading market sentiment and would prefer to observe how experienced traders navigate it before committing to positions independently, copy trading on Tapbit gives you exposure to how active participants are managing risk across different sentiment phases. You can also monitor the broader crypto market to see whether the shift from fear to neutral is reflected across multiple assets or concentrated in Bitcoin alone, which would suggest a more cautious interpretation.
Three Boundaries Worth Keeping in Mind
The index has real uses, but three specific limitations apply in the 2026 market environment.
It measures sentiment, not fundamentals. The index does not capture what the Federal Reserve is likely to do next, whether ETF inflows are accelerating, or whether a major protocol faces regulatory scrutiny. In 2026, macro forces — tariff policy, interest rate expectations, geopolitical tension — have repeatedly moved crypto prices in ways that the sentiment index did not anticipate and could not reflect.
It is calibrated primarily for Bitcoin. The inputs are mostly Bitcoin-specific, which means the index can give a misleading read during altcoin seasons, when Bitcoin's price may be flat or declining while smaller tokens are surging. If your primary exposure is to altcoins, the index is a useful directional reference but not a precise fit for what you are actually trading.
Different providers produce different numbers. This is not an error — it is a structural feature of how different platforms weight their inputs. Choosing one index and using it consistently will give you more reliable trend information than comparing three different providers and trying to reconcile their divergence.
Summary
The crypto fear and greed index is not a prediction tool. It is a measurement tool — one that tells you where collective market emotion stands at a given moment and lets you decide how to position yourself relative to that emotional state.
May 2026 is a meaningful moment in that measurement. After 108 days of fear — including some of the most sustained extreme fear readings since the 2022 bear market — the index has returned to neutral. Bitcoin is holding near $81,000. Total market capitalization is recovering. Whether this marks the beginning of a sustained greed cycle or a temporary pause before another leg down is something no sentiment index can answer.
What the neutral reading does confirm is that the most intense period of panic selling has eased. For disciplined traders, that is a more useful piece of information than a prediction. If you are ready to apply this context to live markets, you can create an account on Tapbit, check available trading rewards for new users, and verify the platform's proof of reserves before depositing. Then let the index do what it is actually good at: keeping your awareness of crowd emotion separate from your trading decisions.
FAQ
Q: What does it mean when the fear and greed index moves from fear to neutral?
A transition from fear to neutral — which is exactly what happened in early May 2026 — signals that the dominant sell pressure driving the market is beginning to ease. It does not confirm that a new uptrend has started, and it does not rule out another dip. What it does indicate is that the extreme pessimism that characterizes fear readings is no longer the dominant emotional force in the market. For traders, it typically means that price action becomes less erratic and more responsive to technical signals, since decisions are being made with less panic driving them. Think of it as the market regaining its footing rather than sprinting in a new direction.
Q: What is the difference between the Alternative.me and CoinMarketCap versions of the index?
The two most widely cited versions use different methodologies, which is why their readings can diverge by 10 to 20 points on the same day. Alternative.me uses five inputs — volatility, momentum and volume, social media, Bitcoin dominance, and Google Trends — with each weighted equally at around 10 to 25 percent. CoinMarketCap's version adds a derivatives component: the put/call ratio in Bitcoin and Ethereum options markets, which captures how professional traders are positioned using financial instruments. CMC's index also uses implied volatility indices rather than realized volatility, which gives it a more forward-looking character. Neither version is objectively correct. For consistency, most retail traders use Alternative.me as their default because it has the longest track record and is most frequently cited in market commentary.
Q: Does the crypto fear and greed index work for altcoins, or only for Bitcoin?
The major versions of the index are calibrated primarily using Bitcoin data — Bitcoin's volatility, Bitcoin dominance, and Bitcoin-related search trends make up the majority of the inputs. This means the index gives you a useful read on overall market sentiment and Bitcoin's emotional cycle specifically, but it may not accurately reflect what is happening in the altcoin market at any given moment. During altcoin seasons — when Bitcoin's price is relatively flat but smaller tokens are rallying strongly — the fear and greed index can show moderate or even fearful readings while many altcoins are producing strong returns. If your portfolio is heavily weighted toward altcoins, treat the index as a broad market backdrop indicator and supplement it with altcoin-specific data such as total altcoin market cap relative to Bitcoin.
Q: Can the fear and greed index predict the next bull run?
No. The index reflects current and very recent sentiment — it is backward-looking in that sense, reacting to what has already happened in price and social activity rather than anticipating what comes next. Historical data shows that extreme fear readings have often preceded recoveries, but that pattern has never been reliable enough to use as a precise entry trigger. The March 2026 period illustrated this clearly: extreme fear persisted for weeks even as prices continued to fall before eventually recovering. The index can tell you that the emotional environment is consistent with past turning points, but it cannot tell you when the turning point will actually occur or how deep a further decline might go before it does.
Q: How often is the fear and greed index updated?
Alternative.me updates its index once daily, typically in the morning UTC. CoinStats updates every 12 hours. Some newer platforms update more frequently — every 15 to 30 minutes — using real-time social and price data. For most trading decisions, the daily reading is sufficient context. Day traders looking for intraday sentiment shifts may prefer a higher-frequency version, but the additional granularity comes with more noise, since short-term social media sentiment can spike and reverse quickly based on individual news events that have no lasting impact on market structure.
Q: What happens to the fear and greed index during a crypto market crash?
During sharp market crashes — the kind triggered by major news events, large liquidation cascades, or sudden macro shocks — the index can drop from neutral or greed into extreme fear within 24 to 48 hours. This is because the volatility and momentum inputs respond quickly to price action, while social media sentiment also shifts rapidly as negative news spreads. During such events, the index often reaches its lowest readings (below 20) at or near the peak of panic selling, which is why it is sometimes used as a rough signal that forced selling may be exhausting itself. However, the index can also remain in extreme fear for extended periods if the broader market context (macro uncertainty, regulatory pressure, institutional withdrawal) sustains selling pressure beyond the initial panic.
Q: Is there a separate fear and greed index for Ethereum or other specific coins?
Alternative.me, which runs the most widely referenced index, focuses specifically on Bitcoin and uses Bitcoin-centric inputs for its main index. Some data providers have begun developing indices for Ethereum or other large-cap assets, but these remain less standardized and less widely cited than the Bitcoin-based version. CoinMarketCap's version incorporates Ethereum implied volatility alongside Bitcoin, making it somewhat more representative of the large-cap crypto market overall rather than Bitcoin alone. If you primarily trade Ethereum, using CMC's index or a platform that explicitly weights Ethereum data will give you a more relevant sentiment reading than the Alternative.me default.