The SOXL stock forecast 2026-2030 below provides concrete price ranges instead of discussing catalysts without a numerical conclusion. Based on the official June 12, 2026 market close of $234.68, the model places SOXL near $250 in the end-2026 base case, approximately $300-$350 in the 2027 base case, and $260-$520 by 2030 if the semiconductor industry grows but experiences normal cyclical corrections.
These are scenario estimates, not analyst consensus targets. SOXL resets its 3x exposure daily, so volatility and the order of daily returns can matter as much as the final direction of semiconductor stocks.
SOXL Price Today and the Forecast Starting Point
Direxion's official fund page reported the following figures:
| Official SOXL Data | Value | Data Date |
|---|---|---|
| Market price close | $234.68 | June 12, 2026 |
| Net asset value | $234.77 | June 12, 2026 |
| One-day market-price change | +4.77% | June 12, 2026 |
| One-month market-price return | +76.67% | May 31, 2026 |
| Three-month market-price return | +257.40% | May 31, 2026 |
| Year-to-date market-price return | +433.76% | May 31, 2026 |
Returns covering less than one year are cumulative rather than annualized. The figures show why a forecast cannot simply extend the recent rally in a straight line. After a gain of more than 400% in five months, both momentum and reversal risk are unusually high.
All targets in this article are split-adjusted equivalents based on the $234.68 reference price. A future share split or reverse split could change the displayed SOXL price without changing the economic value of a position.
SOXL Stock Forecast Starts With the Daily 3x Rule
SOXL aims to produce 300% of the daily performance of its semiconductor benchmark before fees and expenses. If the benchmark rises 1% in a session, the fund targets roughly a 3% gain for that day. If the benchmark falls 1%, the daily target is approximately a 3% loss.
The objective resets after each trading day. It is therefore inaccurate to assume that a 20% benchmark gain over several months must produce a 60% SOXL gain. The result can be higher or lower depending on the order and size of the daily returns.
This distinction is the foundation of any responsible SOXL stock forecast 2030.
Why Daily Reset Changes Long-Term SOXL Returns
Daily reset creates path dependence. Two periods can finish with the same benchmark return while producing different SOXL outcomes.
Imagine a benchmark falling 10% and then rising 11.1%. It returns approximately to its starting level. A daily 3x product would target a 30% decline on the first day and a 33.3% gain on the smaller remaining balance. The leveraged product would still finish below its starting value.
This effect is often called volatility drag or volatility decay, although the result is not always negative. In a strong, persistent trend, daily compounding can work in the fund's favor. In a choppy market with frequent reversals, repeated rebalancing can erode value even when the benchmark makes little net progress.
Three variables matter:
- Direction: sustained semiconductor gains or losses.
- Volatility: the size and frequency of daily swings.
- Sequence: whether gains and losses arrive in a trend or alternate rapidly.
For this article, the simplified forecast model is:
SOXL target = $234.68 × (1 + modeled cumulative SOXL return)
The modeled SOXL return begins with an assumption for the NYSE Semiconductor Index, then adjusts for daily leverage, volatility drag, financing costs and the length of the forecast period. It is not calculated by multiplying a multi-year semiconductor return by exactly three.
For example, the midpoint of the end-2026 bull range assumes a modeled SOXL gain of roughly 55%:
$234.68 × 1.55 = $363.75
That result sits near the midpoint of the $320-$410 bull target range.
AI and Semiconductor Catalysts That Could Move SOXL
The semiconductor industry is exposed to several powerful growth themes. AI data centers require accelerators, memory, networking equipment, optical components and advanced packaging. Growth in inference workloads could extend demand beyond a small group of leading chip designers.
The bullish case is not simply "AI grows." Markets will look for evidence that capital spending converts into revenue and earnings across the semiconductor supply chain. Important catalysts include:
- higher data-center capital expenditure;
- stronger demand for advanced logic and high-bandwidth memory;
- improving foundry utilization and equipment orders;
- broader earnings upgrades among semiconductor companies;
- easing financial conditions and greater appetite for growth assets; and
- successful product cycles in PCs, smartphones, vehicles and industrial systems.
SOXL Stock Forecast 2026, 2027 and 2030
The numerical outlook uses broad ranges because a single target would hide the effect of volatility.
| Forecast Date | Bear Case | Base Case | Bull Case |
|---|---|---|---|
| End of 2026 | $115-$165 | $210-$285 | $320-$410 |
| End of 2027 | $70-$130 | $230-$360 | $420-$650 |
| End of 2030 | $20-$90 | $260-$520 | $700-$1,200 |
Relative to the $234.68 starting price, the 2030 bear range implies an approximate 62%-91% decline. The base range implies a result from roughly 11% to 122% above the starting price. The bull range implies an approximate 198%-411% gain.
Those percentages are not expected annual returns. They are cumulative scenario outcomes and assume no share split changes the displayed price.
How the SOXL Price Targets Were Calculated
| Scenario | Semiconductor Benchmark Assumption | Volatility Assumption | Modeled SOXL Path |
|---|---|---|---|
| Bear | Earnings weaken and the index falls or fails to recover sustainably | Repeated reversals and annualized volatility frequently above 45% | Daily leverage magnifies losses and volatility drag; modeled cumulative return reaches -30% to -91% |
| Base | Semiconductor earnings grow at a moderate long-term rate with normal corrections | Volatility remains elevated but below crisis conditions | SOXL alternates between rallies and drawdowns; modeled cumulative return ranges from about -11% in 2026 to +122% by 2030 |
| Bull | AI spending, memory demand and equipment orders support sustained index gains | Strong trend with fewer violent reversals | Positive compounding outweighs drag; modeled cumulative return reaches +36% to +411% |
The model is intentionally conservative relative to SOXL's recent performance. Direxion reported a 433.76% year-to-date market-price return through May 31, 2026, but repeating that gain every year would produce an implausible result. The forecast therefore assumes that returns normalize after the exceptional rally.
Bull Case
The end-2026 bull target is $320-$410, with a midpoint near $365. It assumes that the semiconductor index continues rising through the second half of 2026 while realized volatility becomes less destructive than it was during the initial surge.
The 2027 bull range rises to $420-$650. By 2030, the model reaches $700-$1,200 only if semiconductor revenue growth extends beyond a few AI leaders and the benchmark experiences several sustained advances rather than repeated boom-and-bust reversals.
The strongest confirmation would be broad participation, positive earnings revisions and manageable volatility.
Base Case
The end-2026 base range is $210-$285. Its midpoint is close to $250, implying that SOXL consolidates much of its enormous year-to-date gain instead of immediately extending it.
The 2027 base range is $230-$360, followed by $260-$520 in 2030. This case assumes long-term semiconductor growth but includes inventory adjustments, valuation corrections and periods in which volatility drag consumes part of the benchmark's gains.
Bear Case
The end-2026 bear target is $115-$165, equivalent to a decline of roughly 30%-51% from the June 12 reference price. A leveraged ETF can experience that type of drawdown even without a full semiconductor recession.
The bear range falls to $70-$130 in 2027 and $20-$90 by 2030 if earnings weaken, liquidity tightens and high volatility repeatedly damages compounding. A later semiconductor recovery may not restore SOXL to a previous high quickly because the fund must compound from a smaller base.
Signals That Could Confirm or Break Each Scenario
A forecast becomes more useful when it includes evidence that can invalidate it. Traders can watch:
- Semiconductor earnings revisions: Are analysts raising or cutting forward estimates?
- Market breadth: Are most benchmark constituents participating?
- AI capital expenditure: Are major customers maintaining or expanding budgets?
- Inventory and utilization: Are manufacturers reporting balanced supply or renewed excess?
- Interest rates and liquidity: Are financial conditions supporting high-duration growth assets?
- Realized volatility: Is the market trending smoothly or reversing violently?
These indicators should be reviewed together. One announcement is not enough to confirm a multi-year trend.
How to Trade SOXLUSDT Perpetuals on Tapbit
Tapbit offers a SOXL-linked perpetual contract for traders seeking directional exposure without purchasing ETF shares. A perpetual contract is a derivative: it does not confer ownership of SOXL ETF shares, dividends or underlying semiconductor holdings.
- Create an account or log in, complete the required account checks and fund the relevant derivatives wallet.
- Open trade SOXLUSDT perpetuals and confirm that the selected market is the SOXLUSDT perpetual pair.
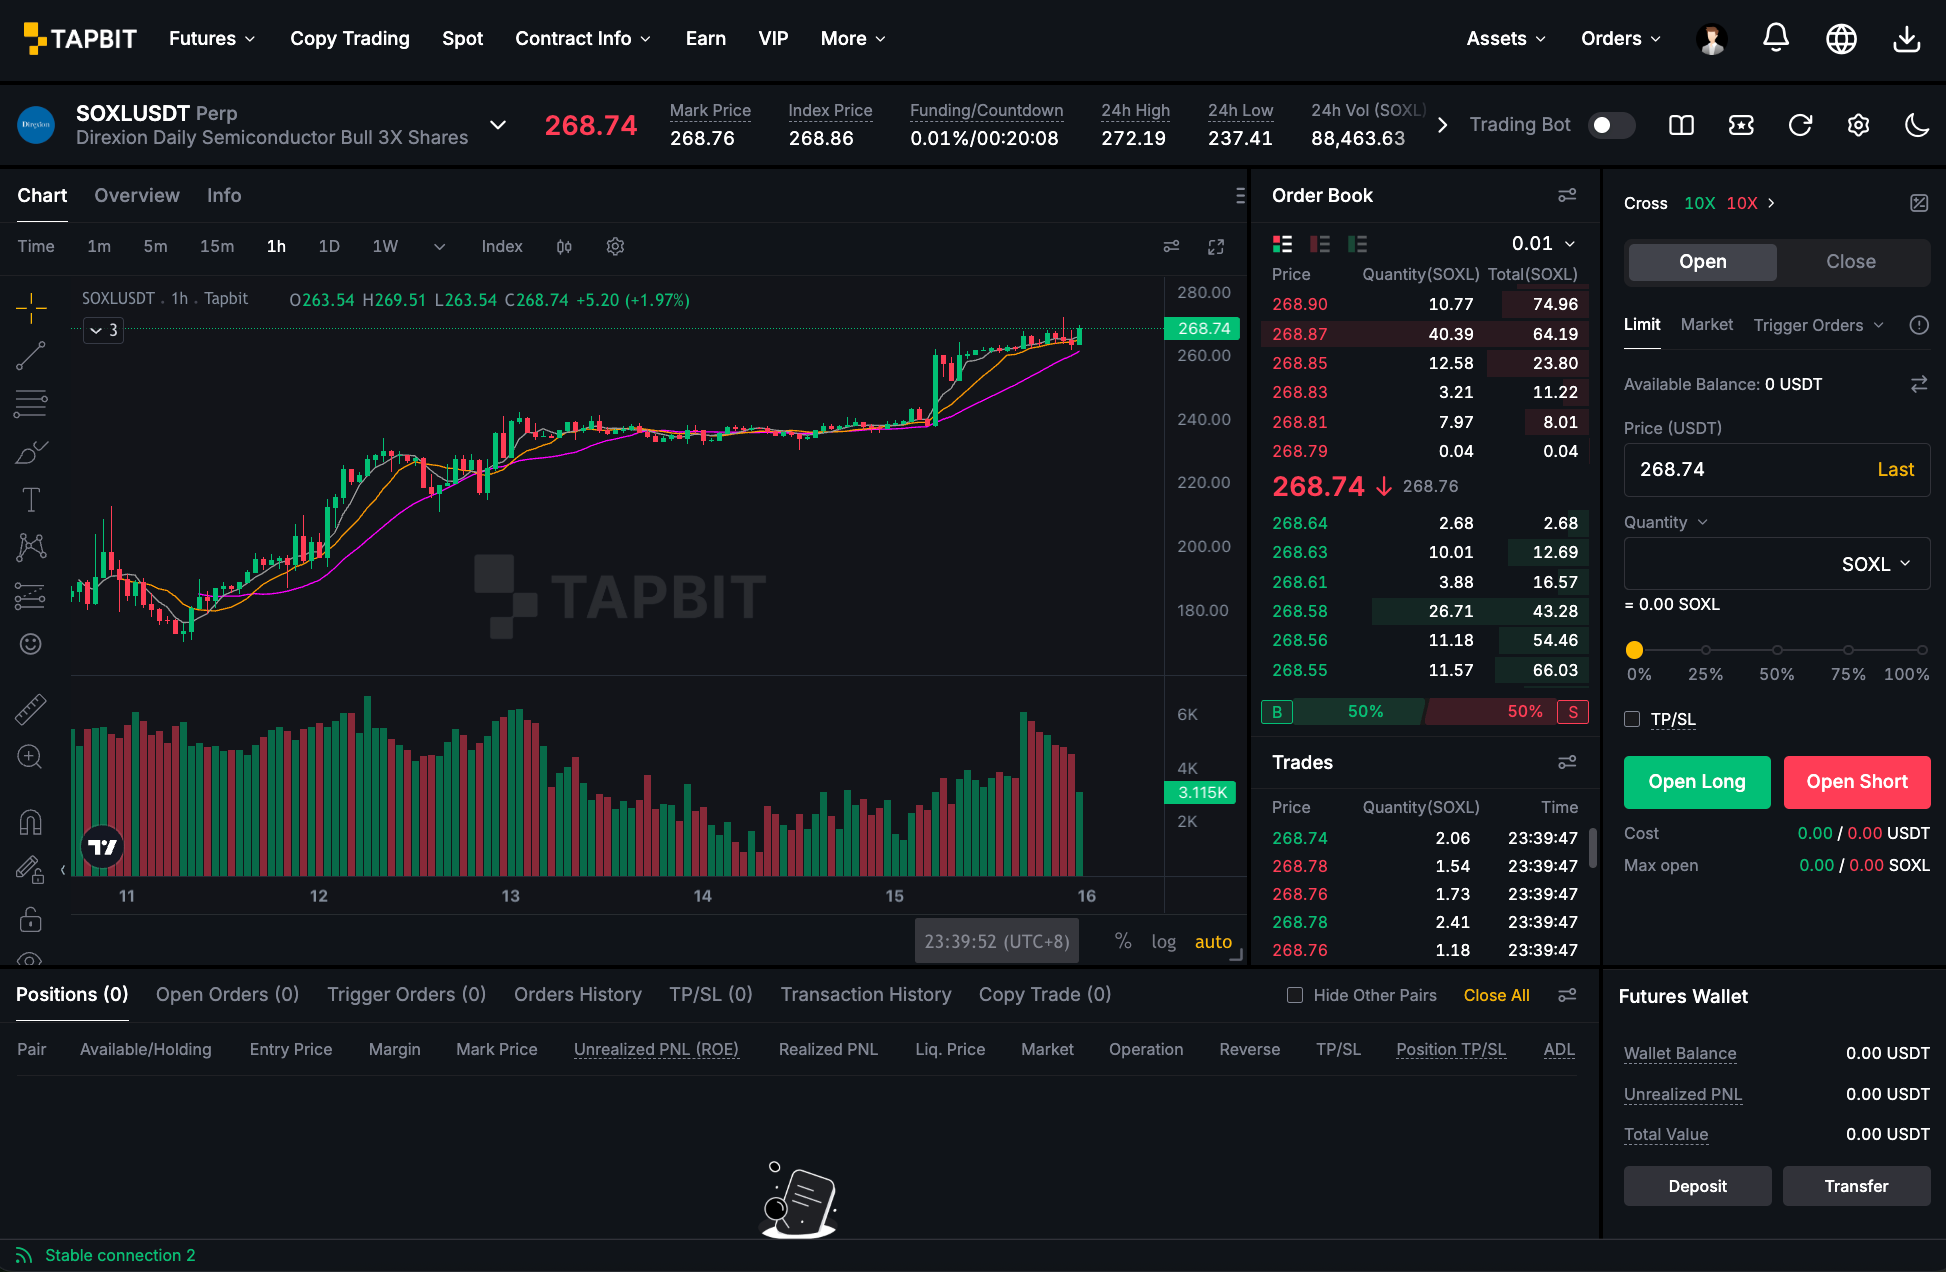
- Review the mark and index prices, funding information, recent range, volume and order book; then choose the margin mode, leverage and order type appropriate for the plan.
- Define position size and set take-profit and stop-loss levels before selecting long or short.
Funding, liquidity and trading conditions can change. Traders can also view market data to compare the wider risk environment before opening a position.
Final SOXL Outlook Through 2030
Using $234.68 as the reference price, the central SOXL stock forecast is $210-$285 for the end of 2026, $230-$360 for 2027 and $260-$520 for 2030. The wider bull and bear ranges reflect the unusually large impact of daily leverage.
A move toward $700-$1,200 by 2030 requires strong semiconductor fundamentals and relatively favorable trend compounding. A fall toward $20-$90 becomes possible if the sector suffers a prolonged downturn or repeated volatility destroys value.
The forecast should be recalculated whenever the reference price, benchmark trend, fund structure or share count changes. SOXL is not a normal buy-and-forget semiconductor fund.
FAQ
Is SOXL a good buy now?
That depends on the trader's semiconductor outlook, time horizon and ability to manage a daily leveraged product. SOXL is built for daily 3x exposure and can behave very differently from an unleveraged ETF over longer periods.
How high will SOXL go?
The modeled bull target is $320-$410 by the end of 2026, $420-$650 in 2027 and $700-$1,200 by 2030. These are split-adjusted scenario ranges, not fixed maximum prices.
How much could SOXL cost in 2030?
The model's 2030 base range is $260-$520. Its bull range is $700-$1,200, while the bear range is $20-$90. All three use the June 12, 2026 market close of $234.68 as the starting point.
What is the difference between SOXL and SOXX?
SOXX is an unleveraged semiconductor ETF, while SOXL seeks 300% of its benchmark's daily return before fees and expenses. Their benchmarks and portfolio implementation may also differ, so official fund documents should be checked.
Can SOXL fall even if its benchmark finishes higher?
Yes. During a volatile period, daily reset and compounding can leave SOXL with a loss even if the benchmark eventually finishes modestly higher.