

In retail crypto trading, a staggering amount of capital is lost to emotional decision-making. Novice traders often buy because an asset "feels cheap" or sell because the market "looks scary."
Professional traders do not rely on feelings; they rely on market structure.
This is the core of Technical Analysis (TA). TA is not a crystal ball that predicts the future. Rather, it is a discipline that studies historical price action and volume data to identify high-probability outcomes. By reading the chart, you are reading the aggregate psychology of millions of buyers and sellers.
Whether you are swing trading Bitcoin or analyzing altcoins on the Tapbit terminal, you need a system. Here is a breakdown of the five foundational tools you must master to transition from guessing to trading.
The Raw Data: Candlestick Charts
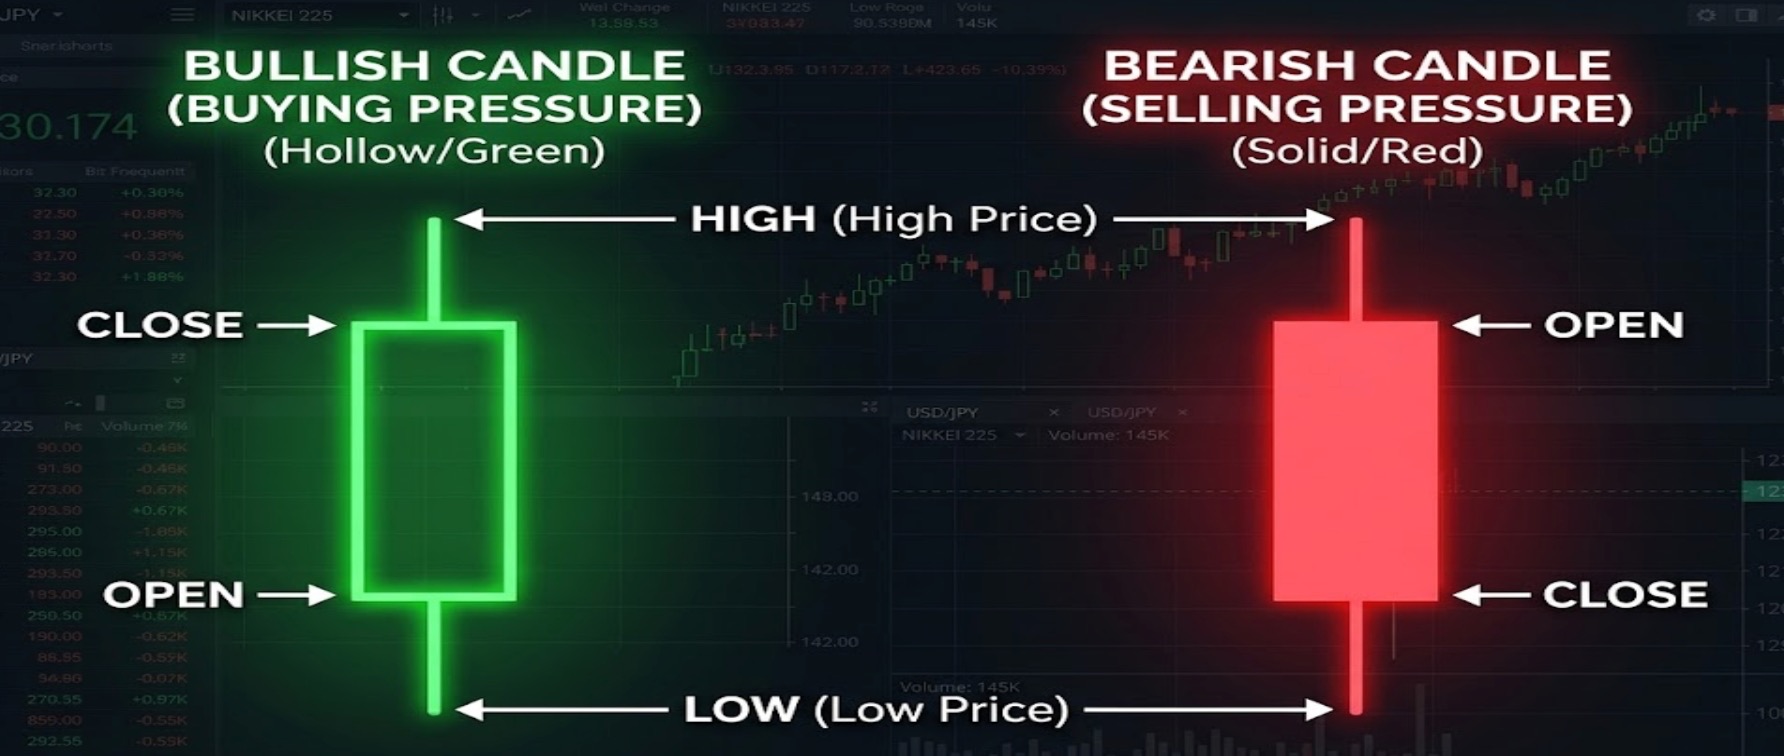
Forget line charts. If you want to understand market microstructure, you must read Japanese Candlesticks. Each "candle" represents the total price action over a specific timeframe (e.g., 1 hour, 1 day, 1 week).
Every candlestick delivers four critical data points (OHLC):
-
Open: The asset's price at the exact start of the timeframe.
-
Close: The asset's price at the exact end of the timeframe.
-
High & Low: The extreme price points reached during that period, forming the thin lines known as the "wicks" or "shadows."
The Pro's Edge: The wicks tell the real story. A green candle with a massive lower wick indicates that while sellers aggressively pushed the price down, buyers completely overpowered them and drove the price back up. This is called a "rejection" and is a classic bullish reversal signal.
The Battlegrounds: Support and Resistance
Market prices do not move randomly; they bounce between psychological zones of supply and demand.
-
Support (The Floor): A historical price zone where downward momentum stops because demand (buyers) overwhelms supply (sellers). The market collectively agrees the asset is "undervalued" here.
-
Resistance (The Ceiling): A price zone where upward momentum halts because supply (sellers taking profit) overwhelms demand.
The Pro's Edge: A common amateur mistake is assuming a support level gets stronger every time it is hit. The opposite is true. Every time a price tests a support or resistance level, it absorbs liquidity. The more a level is hammered, the more likely it is to break. Once a heavy resistance ceiling is broken, it frequently flips to become a new support floor.
Market Structure: Trend Lines
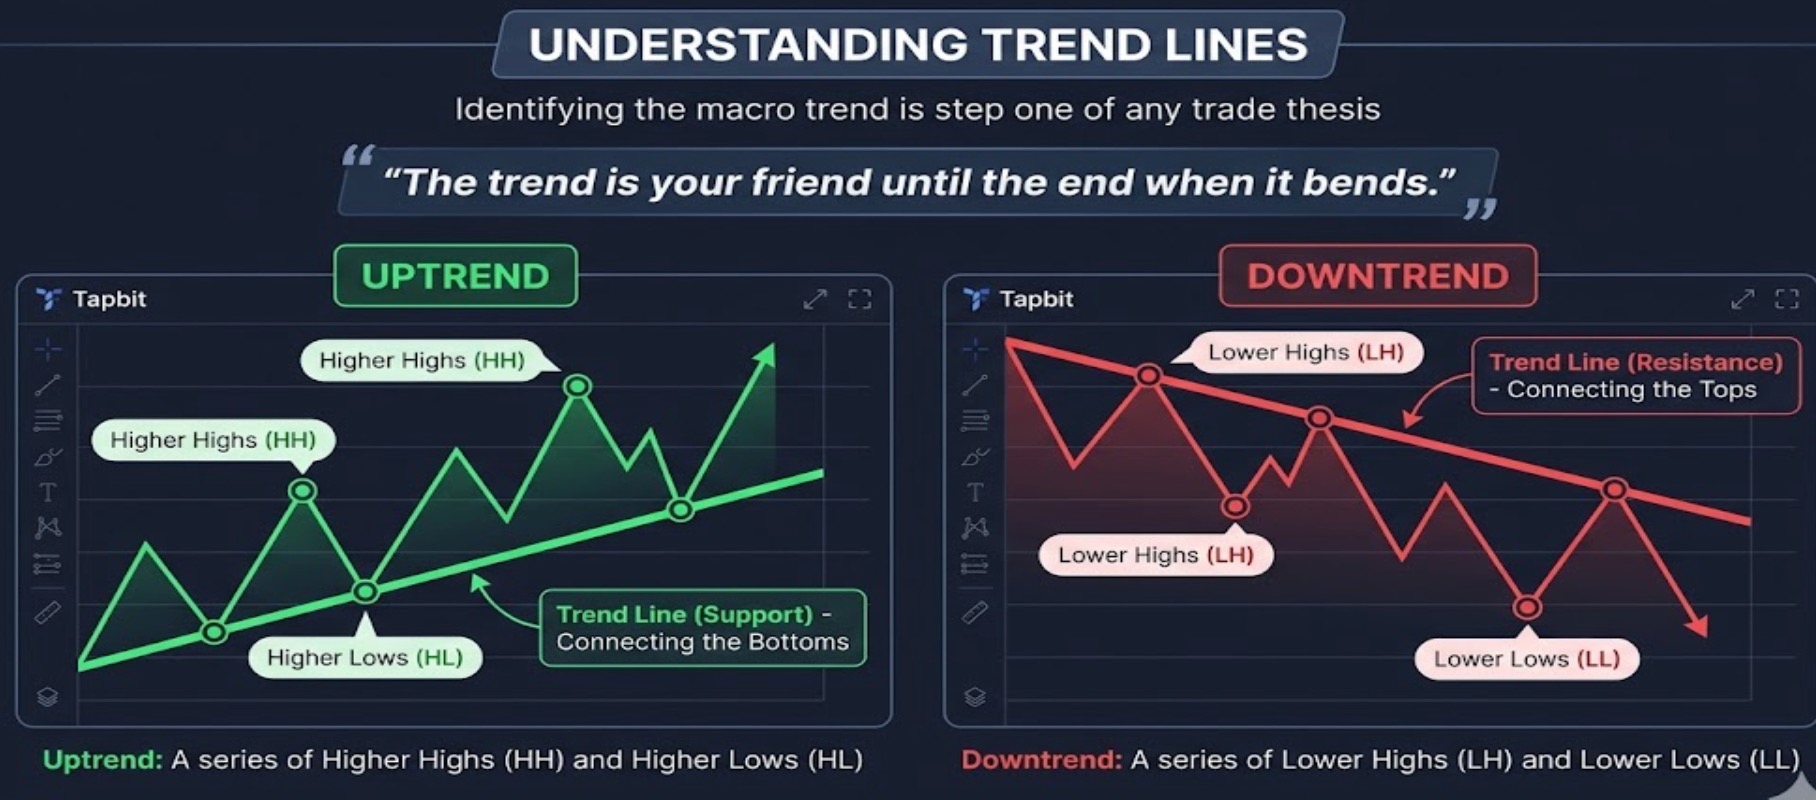
"The trend is your friend until the end when it bends." Identifying the macro trend is step one of any trade thesis.
You can visualize trends on the Tapbit charting interface by connecting the structural pivot points:
-
Uptrend: A series of Higher Highs (HH) and Higher Lows (HL). You draw the trendline connecting the bottoms(support).
-
Downtrend: A series of Lower Highs (LH) and Lower Lows (LL). You draw the trendline connecting the tops(resistance).
The Pro's Edge: Never counter-trade a strong trend line without confirmation. If an asset violently breaks and closes below a multi-month upward trendline, the market structure has shifted. Protect your capital and exit the long position.
Filtering the Noise: Moving Averages (MA)
Crypto markets are highly volatile, making individual candlesticks occasionally deceptive. Moving Averages smooth out this price data to reveal the true underlying trend.
-
Simple Moving Average (SMA): The average price over the last N periods (e.g., a 50-day SMA).
-
Exponential Moving Average (EMA): Similar to the SMA, but it applies more mathematical weight to recentprice action. EMAs react to market shifts much faster.
The Pro's Edge: Moving averages act as dynamic support and resistance. In a strong bull market, pullbacks to the 20-day or 50-day EMA are heavily bought by algorithms and institutions. Furthermore, when a short-term MA crosses above a long-term MA (the "Golden Cross"), it is a widely recognized bullish structural signal.
Identifying Extremes: The Relative Strength Index (RSI)
The Relative Strength Index (RSI) is a momentum oscillator that measures the speed and magnitude of recent price changes. It oscillates on a scale from 0 to 100.
-
Overbought (>70): Suggests the asset has surged too fast and may be due for a corrective pullback.
-
Oversold (<30): Suggests the asset has been aggressively dumped and may be undervalued, priming it for a bounce.
The Pro's Edge: Do not short a crypto asset just because the RSI hits 75. Crypto markets are explosive. During structural bull runs, Bitcoin can remain "overbought" (RSI > 70) for weeks while the price doubles. Use RSI to identify divergences(e.g., when the price makes a new high, but the RSI makes a lower high), which signals exhausting momentum.
The Bottom Line: Trading with Confluence
No single indicator guarantees a profitable trade. Professional analysts look for Confluence—the alignment of multiple technical signals. If the price hits a macro Support zone, touches the 50-day EMA, and the RSI shows it is deeply Oversold, your probability of a successful long trade increases exponentially.
Ready to build your trading system?
-
Open the advanced charting terminal on the Tapbit Exchange.
-
Select your preferred asset and open the "Indicators" tab to apply your Moving Averages and RSI.
-
Log in to your account to execute your technical thesis, or Register today to trade with institutional-grade liquidity.
Frequently Asked Questions (FAQ)
Does Technical Analysis actually work in crypto?
Yes. Because crypto lacks traditional valuation metrics (like P/E ratios or quarterly earnings), the market is heavily driven by human psychology, algorithmic trading bots, and historical price memory. TA is the best tool for visualizing these exact forces.
Which timeframe is best for a beginner?
Novices often lose money by getting chopped up on the 1-minute or 5-minute charts, which are full of random market noise. Start with higher timeframes—the Daily (1D) or 4-Hour (4H) charts. Higher timeframes filter out the noise and provide far more reliable technical signals.
Should I use Technical Analysis (TA) or Fundamental Analysis (FA)?
You must use both. Fundamental Analysis (macroeconomics, token unlocks, protocol upgrades) tells you what to buy and what the long-term direction is. Technical Analysis tells you when to buy it and where to place your stop-loss.