

This Bitcoin price prediction July 2026 is not a promise that BTC will hit one exact level. It is a scenario framework. Bitcoin enters the final week of June near $61,800, with traders watching ETF flows, Fed signals, and whether BTC can reclaim the $65,000-$67,000 resistance band.
The setup is similar to the May-to-June transition covered in Tapbit Learn's earlier BTC price prediction May 2026, but July has a different tone. ETF-flow anxiety is stronger, support levels are more fragile, and traders are less willing to ignore macro pressure.
For recent context, a late-June BTC snapshot showed Bitcoin near $61,778.86, down 1.26% over 24 hours, with 24H volume around $44.85 billion. Compared with a recent 24H high near $62,700 and the previous June attempt to hold the $70,000-$72,000 area, BTC is now trading much closer to support than resistance. From $70,800 to $61,778.86, Bitcoin is down roughly 12.7%. Those numbers explain why July traders are treating $60,000-$62,000 as the first major decision zone.
Bitcoin Price Prediction July 2026: Starting Point
Late June gives July a clear starting point. Bitcoin recently moved from the $70,000-$72,000 area into the low-$60,000s, after a sharp June pullback. That price action created three important lines:
- Support / decision zone: $60,000-$62,000
- First resistance: $65,000-$67,000
- Trend-repair resistance: $70,000-$72,000
If BTC holds the low-$60,000s and moves back above first resistance, July may look like a recovery month. If BTC loses $60,000, the market may need to search for liquidity near the high-$50,000s.
This is why a useful Bitcoin price prediction July 2026 should focus less on one headline target and more on confirmation signals.
Key BTC Price Levels to Watch
The first July question is simple: can Bitcoin stay above the $60K area?
The $60,000-$62,000 area matters because BTC is now trading near it. A strong bounce from this area would suggest that buyers still see value near round-number support. A weak reaction could invite another test lower.
The $65,000-$67,000 area matters because it was former support and may now act as resistance. A clean reclaim above that zone would show that sellers are losing control. The $70,000-$72,000 area remains the stronger trend-repair zone.
Above $72,000, traders may start watching $75,000 and then $80,000. Below $60,000, the next visible downside zone is roughly $56,000-$58,000.
Forecast Methodology: How the July Ranges Are Built
This forecast uses a scenario method rather than a single fixed target:
- Start with a late-June BTC reference price near $61,800.
- Mark nearby support at $60,000-$62,000, first resistance at $65,000-$67,000, and stronger resistance at $70,000-$72,000.
- Add demand signals from ETF flows, spot volume, and futures funding.
- Adjust the range based on macro tone, liquidity, and whether BTC closes above or below key levels.
Worked example: if BTC trades near $61,800, a move to $65,000 would be about +5.2%. A move to $72,000 would be about +16.5%. A drop to $58,000 would be about -6.1%. This is why the July outlook is framed as conditional paths instead of one absolute target.
ETF Flows, Fed Policy, and Bitcoin Dominance
Price levels matter, but they do not move alone. Three drivers may define July:
1. ETF flows
If spot Bitcoin ETF outflows slow or reverse, BTC could regain confidence. Tapbit Learn's article on Bitcoin ETF outflows explains why institutional flow data can affect both spot demand and market sentiment.
2. Fed and liquidity conditions
Bitcoin tends to struggle when traders expect tighter financial conditions. If Fed commentary becomes less restrictive, risk appetite may improve. If the dollar and yields remain firm, BTC may stay under pressure.
3. Bitcoin dominance
If BTC dominance rises while prices fall, traders may be hiding in Bitcoin relative to altcoins. If dominance falls while BTC stabilizes, capital may rotate back into higher-beta crypto assets. For background, see Tapbit Learn's guide to Bitcoin dominance.
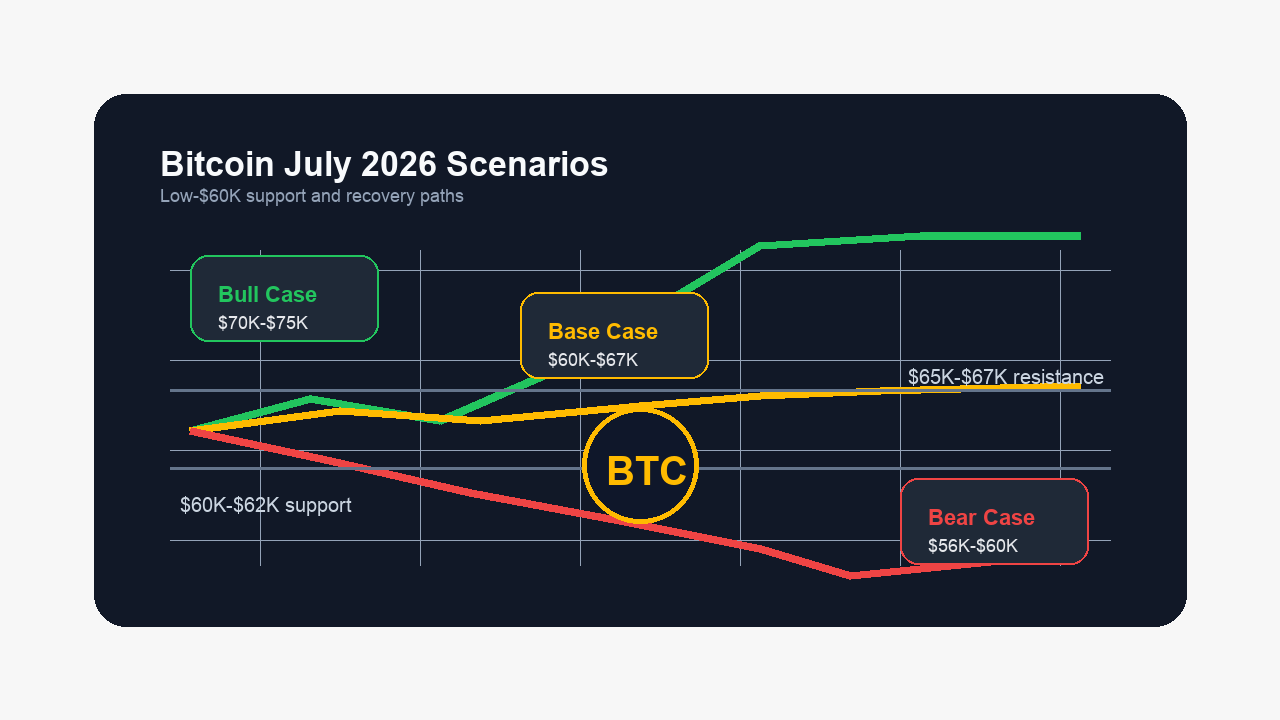
Three BTC Scenarios for July 2026
The table below turns the July setup into three practical scenarios.
| Scenario | BTC Range | What Needs to Happen | Market Signal |
|---|---|---|---|
| Bull case | $70,000-$75,000 | ETF flows improve, BTC reclaims $65K-$67K and then $72K | Recovery breakout |
| Base case | $60,000-$67,000 | $60K holds but buyers lack a strong catalyst | Low-range consolidation |
| Bear case | $56,000-$60,000 | $60K fails, outflows persist, leverage unwinds | Lower liquidity sweep |
The base case may be the most realistic unless a new catalyst appears. Bitcoin can spend weeks inside a range after a sharp move because both buyers and sellers need confirmation.
The bullish case requires more than a quick bounce. BTC needs stronger ETF-flow data, a reclaim of resistance, and improved risk appetite. The bearish case becomes more likely if BTC closes below support with rising volume and negative funding pressure.
How to Trade BTC Scenarios on Tapbit
Tapbit users can approach BTC through futures or spot. Futures fit active scenario trading, while spot is simpler for direct BTC/USDT exposure. You can create an account and view crypto prices before choosing a product.
BTC Futures Steps
Use BTC futures if you want to trade both bullish and bearish scenarios with leverage controls.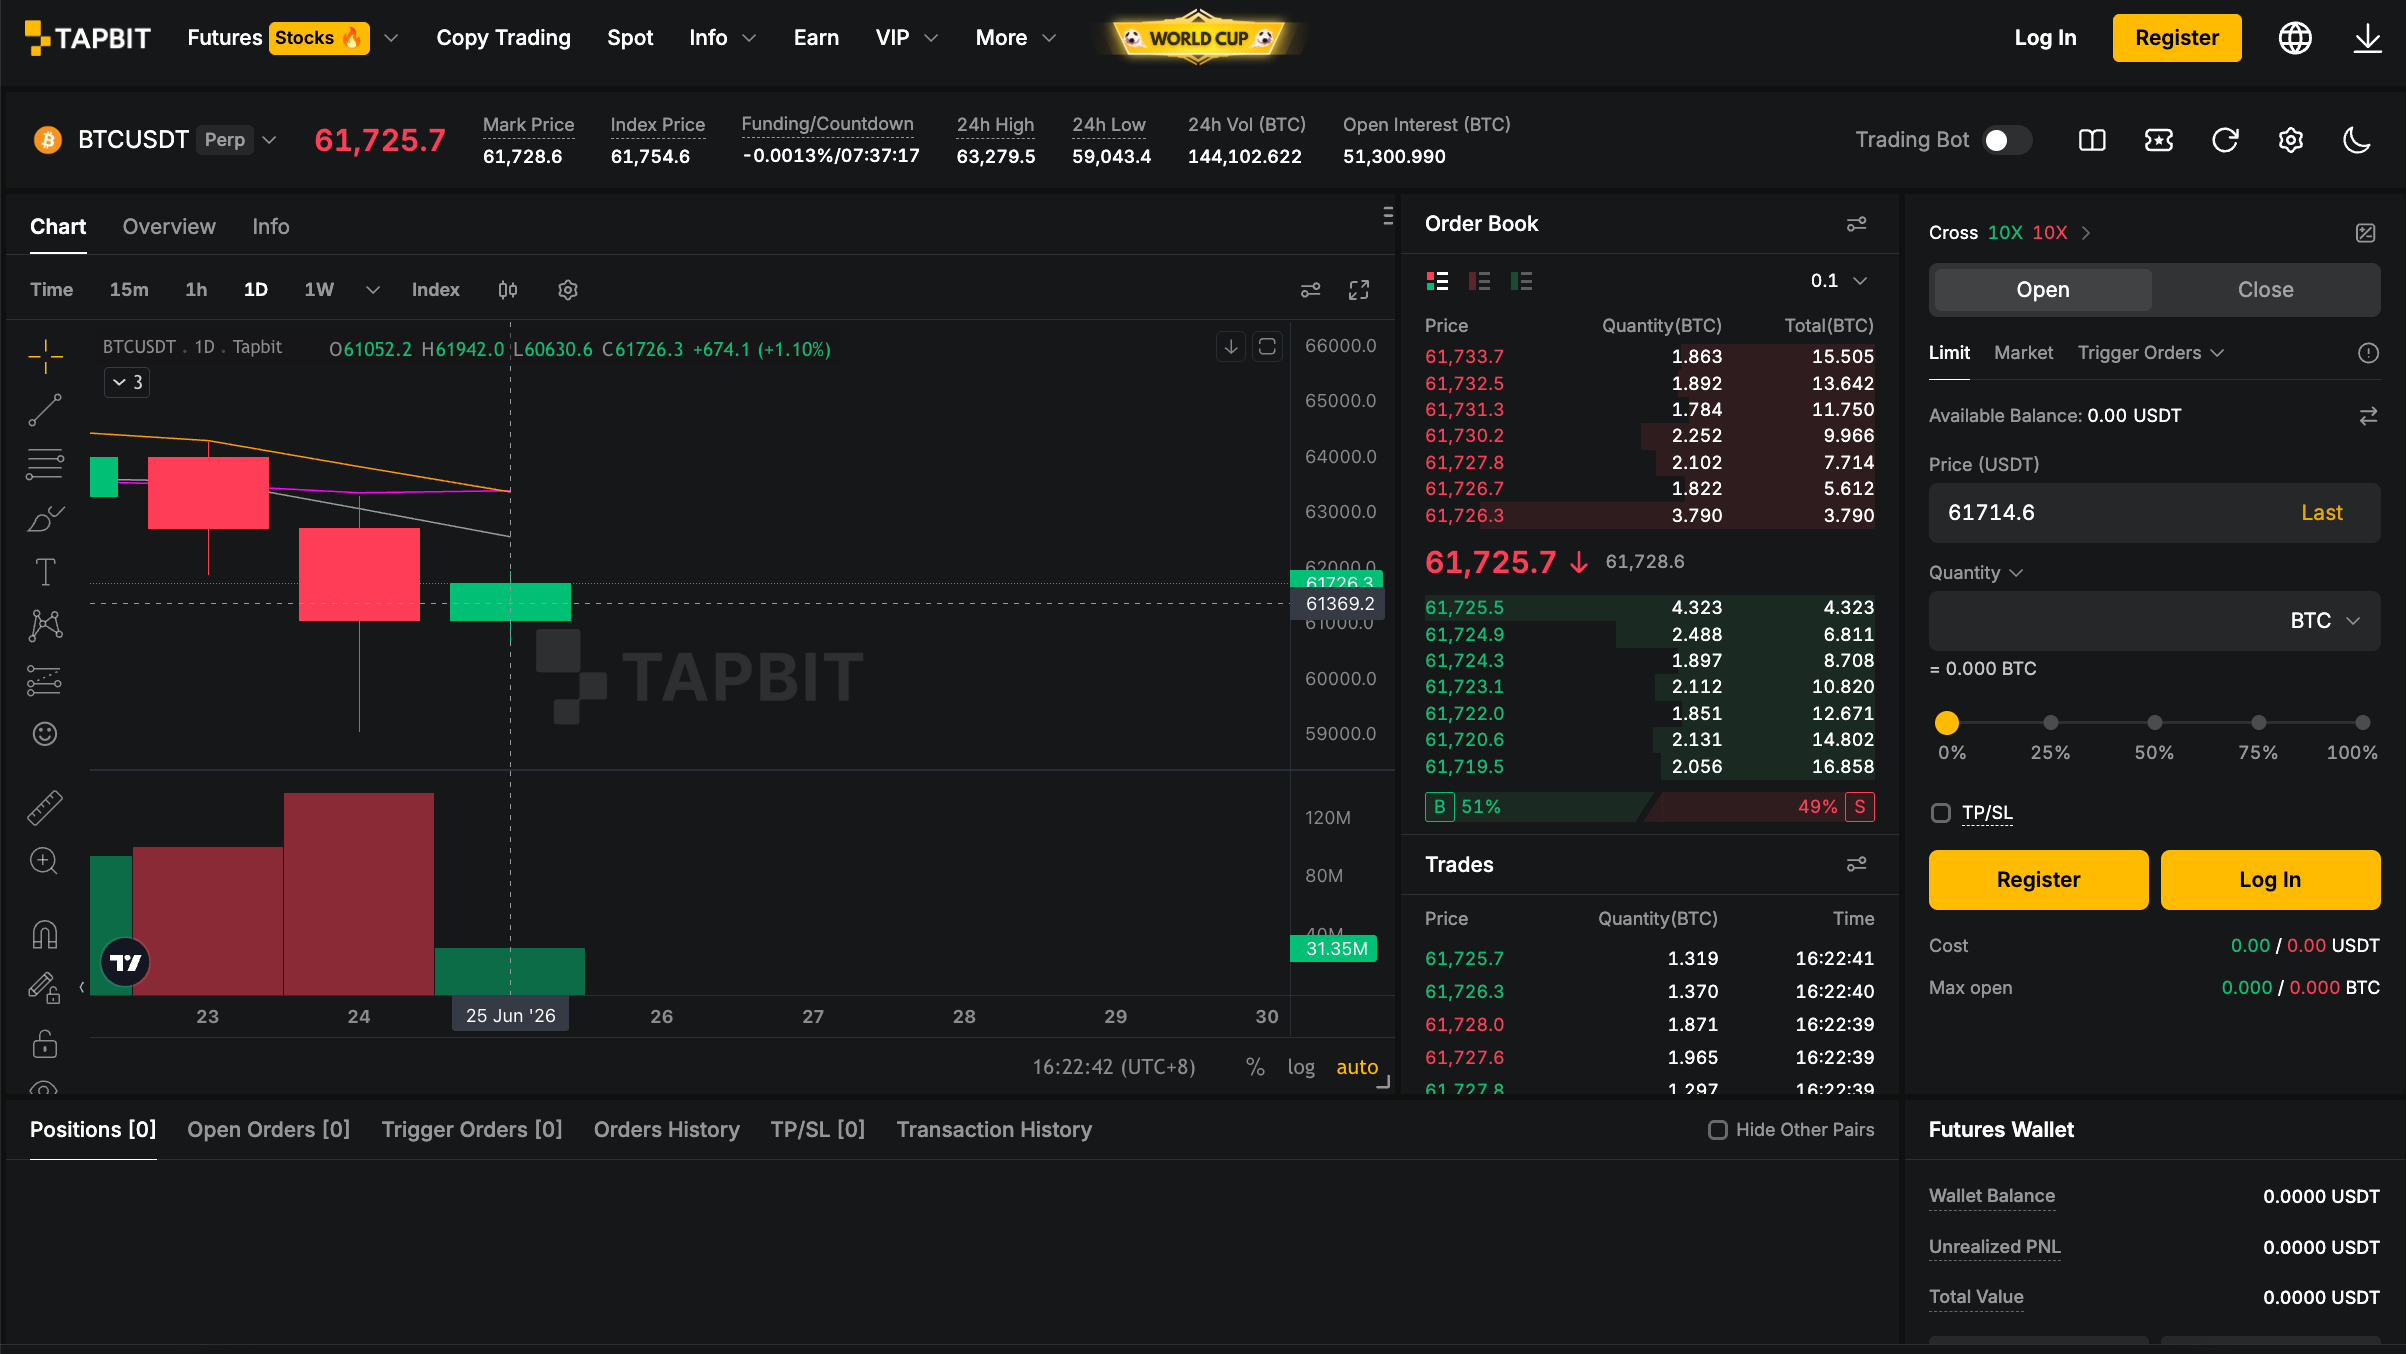
- Open BTCUSDT futures and check mark price, index price, funding, 24H range, and order book.
- Map your scenario: reclaim above $65K-$67K, range trade, or support break below $60K.
- Choose margin mode, leverage, direction, and order type.
- Set TP/SL before opening the position.
BTC Spot Steps
Use BTC spot if you want direct BTC exposure without leverage.
- Open BTC/USDT spot and review price, spread, and 24H volume.
- Decide whether to buy immediately or place a limit order near your preferred level.
- Confirm the amount and order type.
- Track the position against the July support and resistance zones.
What Could Invalidate This Forecast
Any Bitcoin price prediction July 2026 can become outdated quickly. The biggest invalidation signals are:
- BTC breaks below $56,000 on heavy volume.
- ETF outflows accelerate again.
- Fed commentary becomes more restrictive than expected.
- A major exchange, custody, or regulatory shock hits crypto sentiment.
- BTC rallies above $82,000 with strong ETF inflows and broad market risk-on behavior.
The institutional picture also matters. Tapbit Learn's guide to Fidelity Bitcoin ETF can help readers understand how ETF demand enters the market and why institutional exposure should be read gradually, not emotionally.
The bottom line: the most useful Bitcoin price prediction July 2026 is conditional. If BTC holds $60,000-$62,000, July can stabilize. If BTC reclaims $65,000-$67,000 and then $70,000-$72,000, the market can target $75,000 or higher. If support fails, the high-$50,000s may become the next test.
FAQ
What is the Bitcoin price prediction for July 2026?
The base case is a range between $60,000 and $67,000, with upside toward $70,000-$75,000 if ETF flows and risk appetite improve.
Can Bitcoin reach $80,000 in July 2026?
Bitcoin could approach $80,000 only if it first reclaims $65,000-$67,000, then $70,000-$72,000, with strong volume and improving ETF-flow data. That is a bullish scenario, not a certainty.
What happens if Bitcoin breaks below $60,000?
A break below $60,000 could expose BTC to a retest of $56,000-$58,000, especially if futures liquidations and ETF outflows continue.
Are ETF flows important for Bitcoin's July forecast?
Yes. ETF flows are one of the clearest institutional demand signals for BTC, especially when the market is already near key support.
Should I trade BTC futures or BTC spot?
BTC futures may fit active traders who understand leverage, while BTC spot may fit users who want direct exposure without leveraged liquidation risk.