

Bitcoin Is Down — Quick Snapshot of What's Happening
At the time of writing (June 3, 2026), Bitcoin is trading in the $66,000–$69,000 range after falling sharply over the past week — more than 45% below its all-time high of approximately $126,200 set in October 2025.
This is not a single-event crash. Analysts tracking the move are citing at least six separate contributing factors, and the consensus is clear that no one of them alone explains the full selloff. A sharp drop with multiple drivers is typically harder to reverse quickly than one caused by a single correctable event.
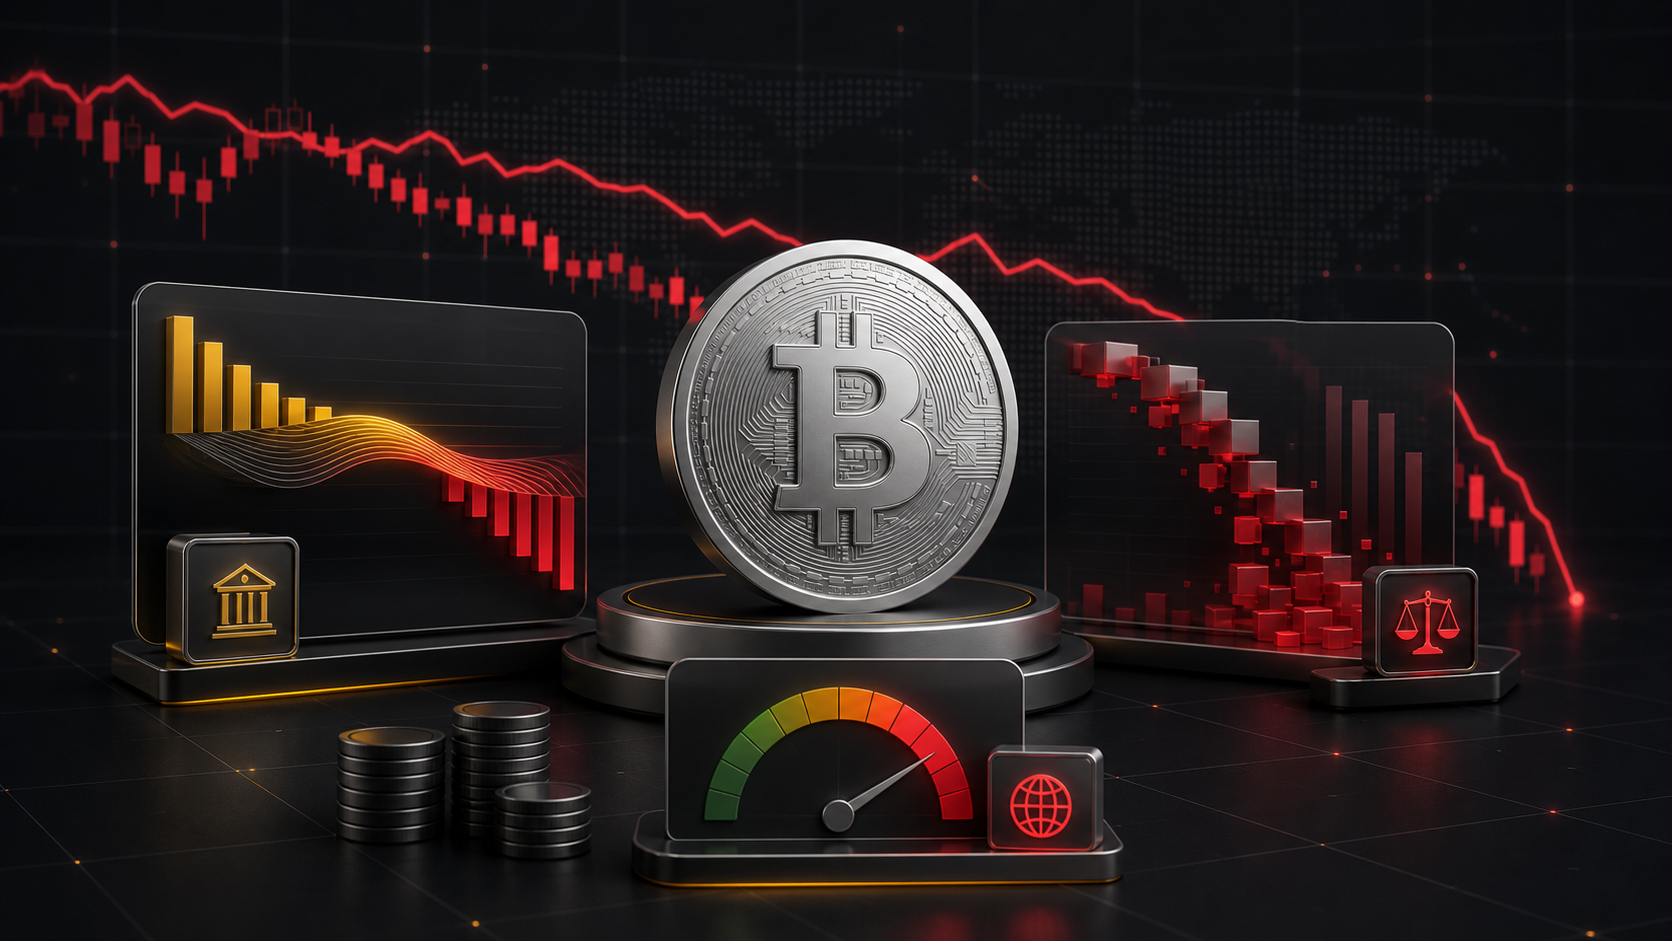
The broad picture: Bitcoin ETFs have faced sustained outflows, a key institutional narrative shifted, on-chain supply anxiety re-emerged, and macro and geopolitical risk turned risk-off. These conditions overlapped within a short timeframe, and cascading liquidations amplified the magnitude. For background on how Bitcoin prices move with broader market conditions, our guide to why crypto moves up or down covers the structural drivers well.
Driver 1 — ETF Outflows Removed a Key Demand Pillar
U.S. spot Bitcoin ETFs recorded approximately $1.42 billion in outflows across roughly 11 consecutive days leading into early June 2026. On June 1 alone, outflows totaled approximately $483.8 million, with BlackRock's IBIT accounting for nearly $440 million of that single-day figure.
Some context: Bloomberg Intelligence analysts noted that $3 billion in outflows from a $100+ billion asset base is modest in relative terms. But sentiment significance is real — Bitcoin ETF inflows had been a central bullish narrative since 2025, and a prolonged outflow streak changes that story in the short term. ETF flows can reverse quickly; a single bad week does not define a long-term trend.
For more on how Bitcoin ETF mechanics work, see our explainer on Fidelity's Bitcoin ETF (FBTC).
Driver 2 — Strategy's Bitcoin Sale Triggered a Narrative Shift
On June 1, 2026, Strategy (formerly MicroStrategy) disclosed in an SEC filing that it sold 32 BTC to fund dividend payouts — its first Bitcoin sale in nearly four years. The previous sale was 704 BTC in December 2022.
The number itself is financially minor. But the market's reaction was about the narrative break, not the size. For years, Strategy's public positioning built its reputation as an institutional anchor of Bitcoin conviction. One sale ended that streak and raised questions about whether the company's approach to its Bitcoin treasury is changing.
Large institutional holders create market psychology effects well beyond their actual trade size. The announcement added pressure to an already weak tape.
Driver 3 — Mt. Gox Wallet Movements Added Supply Fear
Blockchain data showed Mt. Gox transferred approximately 10,422 BTC from cold storage in late May and early June 2026. No confirmed selling has occurred. The transfer itself is not a sale.
But Mt. Gox creditor repayments have historically produced market anxiety because some recipients have sold their repaid Bitcoin after receiving it. The final repayment deadline for remaining creditors is October 31, 2026. Every on-chain movement from the estate renews that concern.
The Mt. Gox news overlap also contributed to the sharp liquidation wave. As prices fell, cascading forced closures of leveraged long positions triggered over $1.2–1.35 billion in crypto liquidations across the market. Leveraged positions amplify moves in both directions — they can make a drop faster and sharper than the underlying drivers alone would suggest.
Driver 4 — Macro and Geopolitical Pressure Turned Risk-Off
Bitcoin has increasingly traded as a high-beta risk asset in this cycle — falling more sharply than traditional assets when sentiment turns negative.
Two macro factors added pressure in early June 2026. First, sticky U.S. inflation data and uncertainty around Federal Reserve rate cut timing kept bond yields elevated and the dollar relatively strong — reducing appetite for volatile assets. Second, a flare-up in U.S.-Iran geopolitical tensions in late May added risk-off pressure across global markets.
A competing narrative also emerged: capital rotation into AI stocks, which have continued to attract institutional flows as an alternative. While gold and silver held relatively steady during the same period, Bitcoin fell — underscoring that it is still treated as a risk-on asset in times of uncertainty.
What Levels Are Traders Watching Right Now?
Commonly cited reference points in analyst commentary as of early June 2026:
| Level | Why It's Watched |
|---|---|
| ~$70,000 | Prior psychological support — broken on the way down |
| ~$69,000 | 2021 all-time high — historically significant zone |
| ~$68,000 | Recent swing low before the sharpest June drop |
| ~$66,000–$67,000 | Intraday lows during the June 2–3 selloff |
Support levels are not certainties. During high-volatility episodes, previously held levels can break quickly — as the $70,000 zone did in early June. Watch how Bitcoin responds when it retests these areas, rather than assuming they will hold.
Track current BTC price movements live on the Tapbit price page. For product fit, BTC futures may suit active traders watching volatility and hedging, while BTC spot is more straightforward for supported-asset exposure without leverage. Our May 2026 Bitcoin price analysis gives useful recent trend context.
How to Trade BTC on Tapbit
📌 BTC futures come first for active traders watching volatility. BTC spot is simpler for direct BTC/USDT exposure.

BTC Futures Steps
- Open BTC futures and check mark price, index price, funding, 24H change, and order-book depth.
- Choose margin mode, leverage, and order type based on your trading plan.
- Set TP/SL before opening a long or short position.
- Create a Tapbit account only after confirming the product fits your risk level.
BTC Spot Steps
- Open BTC spot for direct BTC/USDT trading.
- Check last price, 24H volume, spread, and recent volatility.
- Choose market or limit order based on your entry plan.
- Review order details carefully before placing the trade.
Is Bitcoin Going to Go Back Up?
The honest answer: no one can know with certainty, and anyone claiming otherwise is not giving you reliable information.
What traders are watching as potential recovery conditions:
- ETF inflow reversal — sustained daily net inflows returning would shift the institutional demand narrative
- Leveraged position reset — after $1.2+ billion in liquidations, overleveraged longs are cleared, which can reduce further downside velocity
- Geopolitical de-escalation — reduced U.S.-Iran tension would ease risk-off sentiment
- Macro catalyst — any signal of earlier-than-expected Fed rate cuts would improve risk appetite broadly
- Buyer demand at key levels — sustained buying interest near the $66,000–$69,000 zone
Bitcoin has recovered sharply from multi-month drawdowns in previous cycles. It has also extended corrections further than most expected. Each cycle is different. Recovery, if it comes, will likely require at least some of the above conditions to shift.
Watch ETF flow data daily and monitor macro headlines closely. This article reflects conditions as of June 3, 2026, and is for informational purposes only. It does not constitute investment advice. For perspective on how the broader crypto market reacts alongside Bitcoin, see our overview of key Bitcoin ETF and market movements in recent months.
FAQ
Why did Bitcoin drop below $70,000 in June 2026?
Multiple factors converged: sustained ETF outflows, Strategy's first BTC sale in four years, Mt. Gox wallet movements triggering supply concern, leveraged long liquidations, sticky inflation data, and U.S.-Iran geopolitical tension. No single factor explains the full drop.
Did Strategy selling Bitcoin cause the crash?
Strategy sold 32 BTC — a financially minor amount. The narrative impact was larger than the actual trade. It broke a years-long pattern of accumulation-only behavior, shifting market psychology. The announcement contributed to an already weak tape.
What are Mt. Gox creditors doing with their Bitcoin?
As of early June 2026, Mt. Gox transferred approximately 10,422 BTC from cold storage. No confirmed selling has occurred. The concern is that creditors who receive repaid BTC may choose to sell. The final repayment deadline is October 31, 2026.
How do ETF outflows affect Bitcoin price?
ETF outflows mean money is leaving Bitcoin ETF products. This reduces one channel of institutional demand and signals a shift in short-term sentiment. Outflows don't always directly force BTC spot sales, but they affect market psychology and can compound existing selling pressure.
What support levels are traders watching for BTC now?
Commonly cited levels as of early June 2026: the $70,000 zone (now broken), the 2021 all-time high near $69,000, the $68,000 recent swing low, and the $66,000–$67,000 intraday lows from the June selloff. These are reference points, not certainties.
Is Bitcoin going to recover from this selloff?
No one can say with certainty. Recovery conditions that traders are watching include: ETF inflow reversal, leveraged position reset, geopolitical de-escalation, and improved macro risk appetite. Bitcoin has recovered from larger drawdowns in past cycles, but timing and depth of recoveries vary significantly.


