

The Tesla stock chart remained under pressure near $319.21 after a weak Q2 earnings reaction damaged the short-term trend. The stock has attempted to stabilize, but the current level should be treated as a possible support zone rather than a confirmed bottom.
Tesla’s chart is balancing two narratives. The automotive business has shown improved deliveries, while investors remain focused on lower-than-expected operating profit, heavy AI spending and delays in proving the economics of robotaxis, Optimus and Full Self-Driving.
Tesla Stock Price and Chart Today
TSLA traded near $319 after falling from its pre-earnings area. The first task is to identify whether selling pressure is weakening. A single positive day is not enough; the chart needs a sequence of higher lows, stronger volume on rebounds and reduced volume on pullbacks.
Readers can compare the current setup with Tapbit Learn’s earlier TSLA stock confirmation analysis.
What Does the Tesla Stock Chart Show?
The Q2 decline created an overhead supply zone where investors who bought before earnings may sell into a rebound. This often makes the first recovery difficult even when the long-term story remains intact.
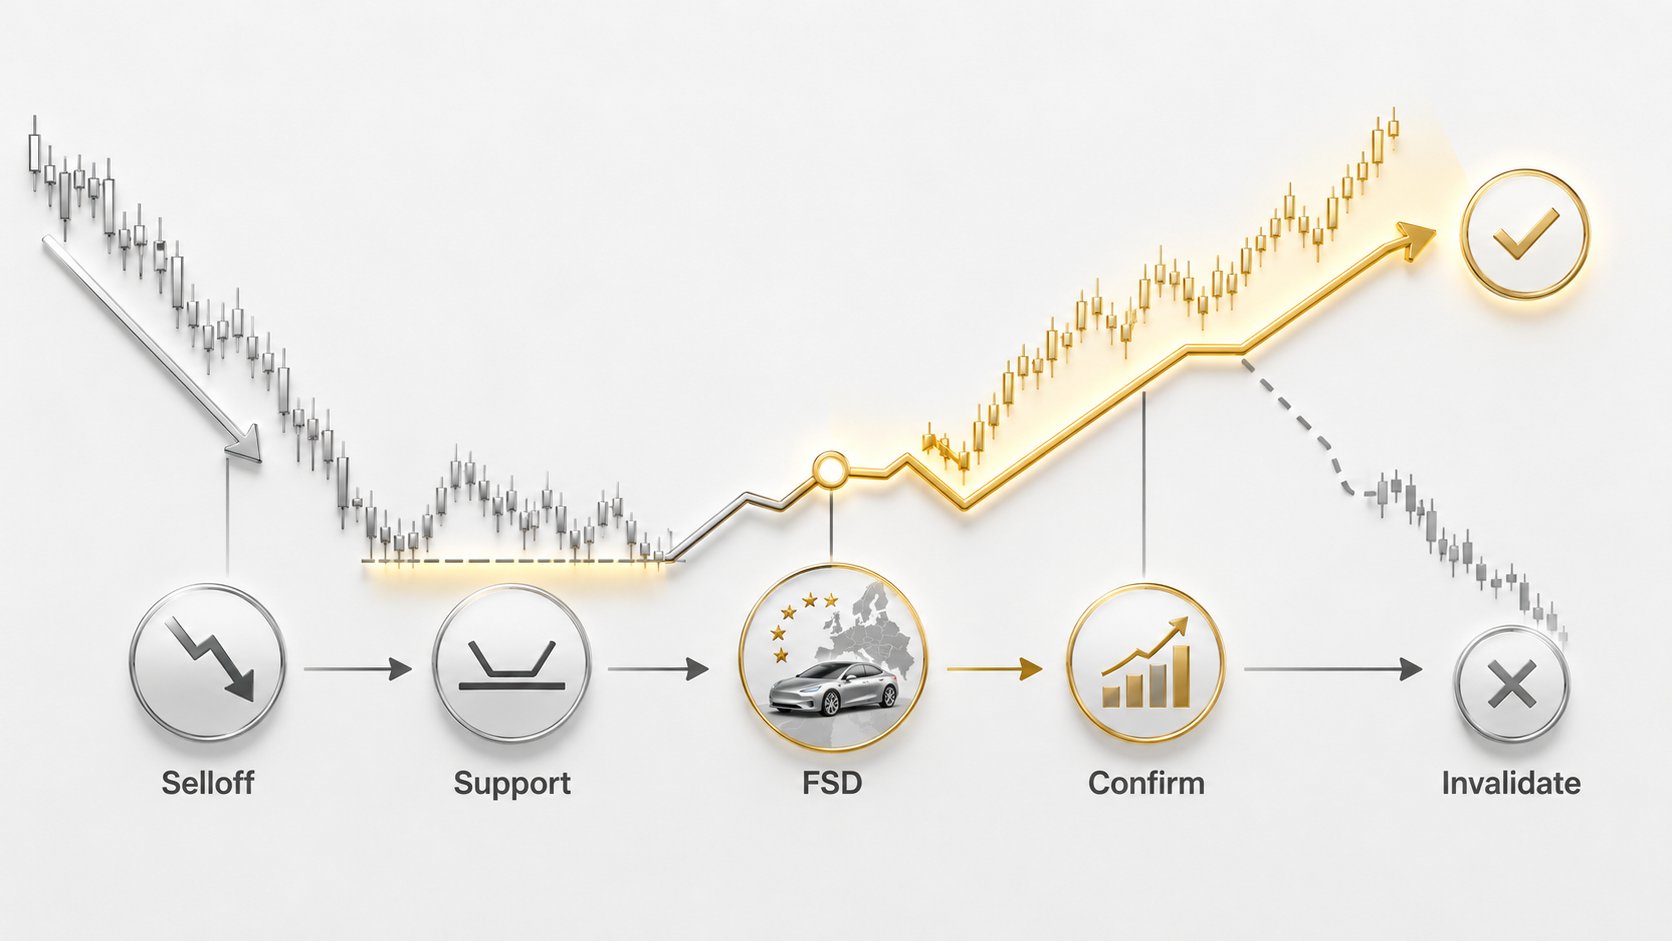
The current structure can be evaluated through three areas:
- Immediate support: the recent low and current $315–$320 region.
- First resistance: the first failed rebound area above the current range.
- Trend confirmation: a sustained move above the post-earnings gap with improving volume.
Tesla Support Levels to Watch
The $315–$320 area is the first visible support region. If buyers repeatedly defend it and the stock forms a higher low, the probability of a tradable bottom improves.
A decisive break below the recent low would invalidate the immediate stabilization thesis. In that case, the market may search for a lower level where valuation and long-term AI expectations attract new demand.
Tesla Resistance and Breakout Confirmation
The first resistance is the nearest post-selloff rebound high. A stronger confirmation requires TSLA to reclaim part of the earnings gap and hold it for more than one session.
Volume matters. A breakout on weak participation can fail quickly, while a move supported by higher volume and improving analyst estimates is more credible.
Why Did Tesla Stock Fall After Q2?
The market focused on operating profit that fell short of expectations and limited evidence that AI projects were already producing enough financial return. Tesla also continues investing heavily in vehicle platforms, autonomous driving, robotics and data-center capacity.
Strong Q2 deliveries show that the automotive business has momentum, but investors increasingly value Tesla on future software and AI income. That raises the standard for disclosures on robotaxi operations, FSD adoption and Optimus deployment.
How AI Spending Changes the Tesla Chart Setup
Tesla’s technical picture is increasingly tied to the market’s judgment of AI investment. Spending on training infrastructure, autonomous-driving development and robotics can pressure near-term margins, but it can also support a higher valuation if investors see evidence of scalable software revenue. The chart will react not only to the size of spending, but to whether each quarter produces measurable commercial progress.
That creates a different confirmation test from a traditional automaker. Vehicle deliveries and automotive margin still matter, yet a durable breakout may also require rising FSD subscriptions, broader regulatory access, visible robotaxi utilization or clearer Optimus deployment milestones. Without those signals, investors may continue treating AI expenditure as a cost rather than a growth asset.
The timing mismatch can keep TSLA volatile. Capital is spent before the related services are widely available, while expectations can change after every regulatory update or product demonstration. Traders should therefore watch whether positive AI headlines lead to higher lows that persist. If the stock repeatedly rallies on announcements but returns below support, the market is signaling that narrative progress has not yet become financial confirmation.
Relative strength is another useful signal. If TSLA begins outperforming the Nasdaq and other large AI-linked stocks while holding support, buyers may be returning specifically to the Tesla thesis. If the wider market rallies while Tesla remains weak, company-specific concerns are probably still limiting the recovery.
Can FSD Europe Become the Next Catalyst?
Tesla had roughly 1.5 million active FSD users at the end of Q2, about 56% more than a year earlier. Current revenue is concentrated in North America, so broader European approval could expand the addressable market.
Approval is not guaranteed on a specific timeline. Regulators continue evaluating safety evidence, transparency and the conditions under which supervised FSD can operate. Investors should treat October or November votes as possible milestones, not confirmed launch dates.
Tesla Stock Outlook
Bull Case
The $315–$320 area holds, FSD Europe progresses and the stock reclaims the first resistance zone. Higher lows and improving volume confirm that the Q2 selloff has been absorbed.
Base Case
Tesla remains range-bound as delivery strength offsets uncertainty around AI returns. The stock needs several weeks to rebuild a technical base.
Bear Case
Support fails, regulatory timelines slip or margins deteriorate. The bearish case is strengthened if rebounds continue failing at lower resistance levels.
How to Trade TSLA-USDT on Tapbit
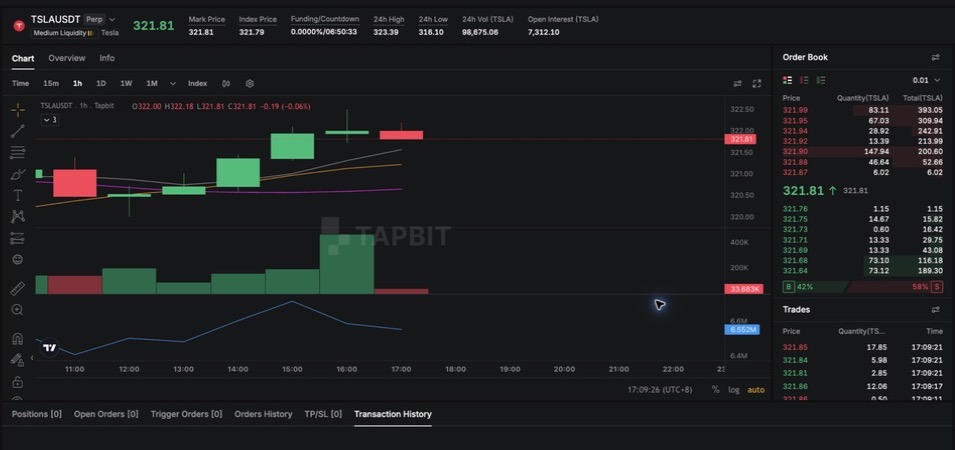
Tapbit users can access Tesla-related price exposure through TSLA-USDT stock-linked perpetual futures. This is a derivative, not direct ownership of Tesla shares, and it does not provide voting rights or dividends.
- Register or log in. Create an account and prepare a futures balance.
- Open TSLA-USDT. Review the contract name, mark price, index price, funding rate and countdown.
- Choose the order. Select Limit, Market or Trigger Order, set quantity and leverage, then choose Open Long or Open Short.
- Manage the chart risk. Set TP/SL and monitor margin around earnings, deliveries, FSD decisions and major product announcements.
Before choosing between shares, derivatives and tokenized stocks, understand that each structure has different legal rights, trading hours and risks.
FAQ
What is Tesla stock trading near?
TSLA traded near $319.21 on August 6, 2026. Refresh the quote before publication.
Is Tesla stock forming a bottom?
It may be stabilizing, but a bottom requires higher lows and a resistance reclaim.
How many active FSD users does Tesla have?
Current reporting places active FSD users near 1.5 million at the end of Q2.
Does TSLA-USDT provide Tesla shares?
No. It is a stock-linked perpetual futures derivative.


