

Bitcoin held above $78,400 during Asian hours on September 1 after gaining about 24% in August, its strongest monthly performance since November 2024. CoinDesk data showed an observed range near $77,200-$79,200. The striking feature was resilience: BTC remained firm while Brent crude moved above $91, Asian equities weakened and markets lifted the probability of a September Federal Reserve hike.
That relative strength is constructive, but it is not proof that Bitcoin has become a safe haven. BTC can trade like scarce digital property in one period and like a high-beta liquidity asset in the next. The immediate question is whether spot demand can absorb macro pressure while leverage stays contained.
Bitcoin Price Today: Latest Market Snapshot
| Indicator | September 1 Snapshot | Interpretation |
|---|---|---|
| Bitcoin | Above $78,400 in Asian hours | Resilient after a 24% August gain |
| Intraday range | About $77,200-$79,200 | Volatility remains active below the headline |
| Brent crude | About $91.15, up 0.7% | Inflation and rate risk increased |
| U.S. 10-year yield | About 4.78% | Tighter financial conditions |
| September Fed hike probability | About 64% | Higher hurdle for risk assets |
Prices vary slightly between exchanges because each venue has its own order book, liquidity and quote timing. CoinDesk observed BTC above $78,400 during Tuesday's Asian hours, with a low near $77,200 and a high near $79,200. These are a time-specific market window, not a guaranteed daily close.
Bitcoin finished August up about 24%, while gold gained roughly 10% and the Nasdaq lagged. Strategy also resumed buying with about $370 million of bitcoin last week. The combination helps explain why sellers struggled to force a deeper decline, but it also means some traders are sitting on gains and may reduce exposure if support fails.
Why Is Bitcoin Holding Near $78K?
August Momentum and Spot Demand
Markets often retain momentum when buyers are willing to accumulate pullbacks rather than chase only breakouts. Spot demand matters because coins purchased without leverage are less exposed to automatic liquidation than futures positions. If BTC holds near $78,000 while open interest stays controlled and spot volume remains healthy, the move has a firmer foundation.
That does not mean every buy is long-term accumulation. Some demand can come from short covering, basis trades or traders rotating from other risk assets. Funding rates, open interest and spot volumes should be read together rather than treated as interchangeable evidence.
Bitcoin's recent move above $80,000 is examined in Tapbit Learn's $80K breakout confirmation analysis. The current market is testing whether that breakout created durable support or only a temporary momentum peak.
Bitcoin's Scarcity Narrative During Geopolitical Stress
Bitcoin's fixed issuance schedule gives investors a scarcity thesis that does not depend on one government, central bank or commodity shipping lane. During geopolitical stress, that can attract buyers seeking a portable, globally traded asset.
However, the safe-haven label requires caution. In abrupt liquidity shocks, traders often sell whatever can be sold quickly. Bitcoin trades around the clock and is widely used as collateral, so it may decline before traditional markets reopen. Short-term resilience is evidence of current demand, not proof that BTC will always rise during conflict.
Thin Liquidity Can Work in Both Directions
A narrow weekend or regional trading window can make the price appear stable until a large order reaches the book. Thin liquidity can produce sharp upward squeezes, but it can also cause rapid downward gaps and clustered liquidations. Traders should not confuse a quiet hour with low risk.
Oil, Inflation and the Fed: Why They Matter for BTC
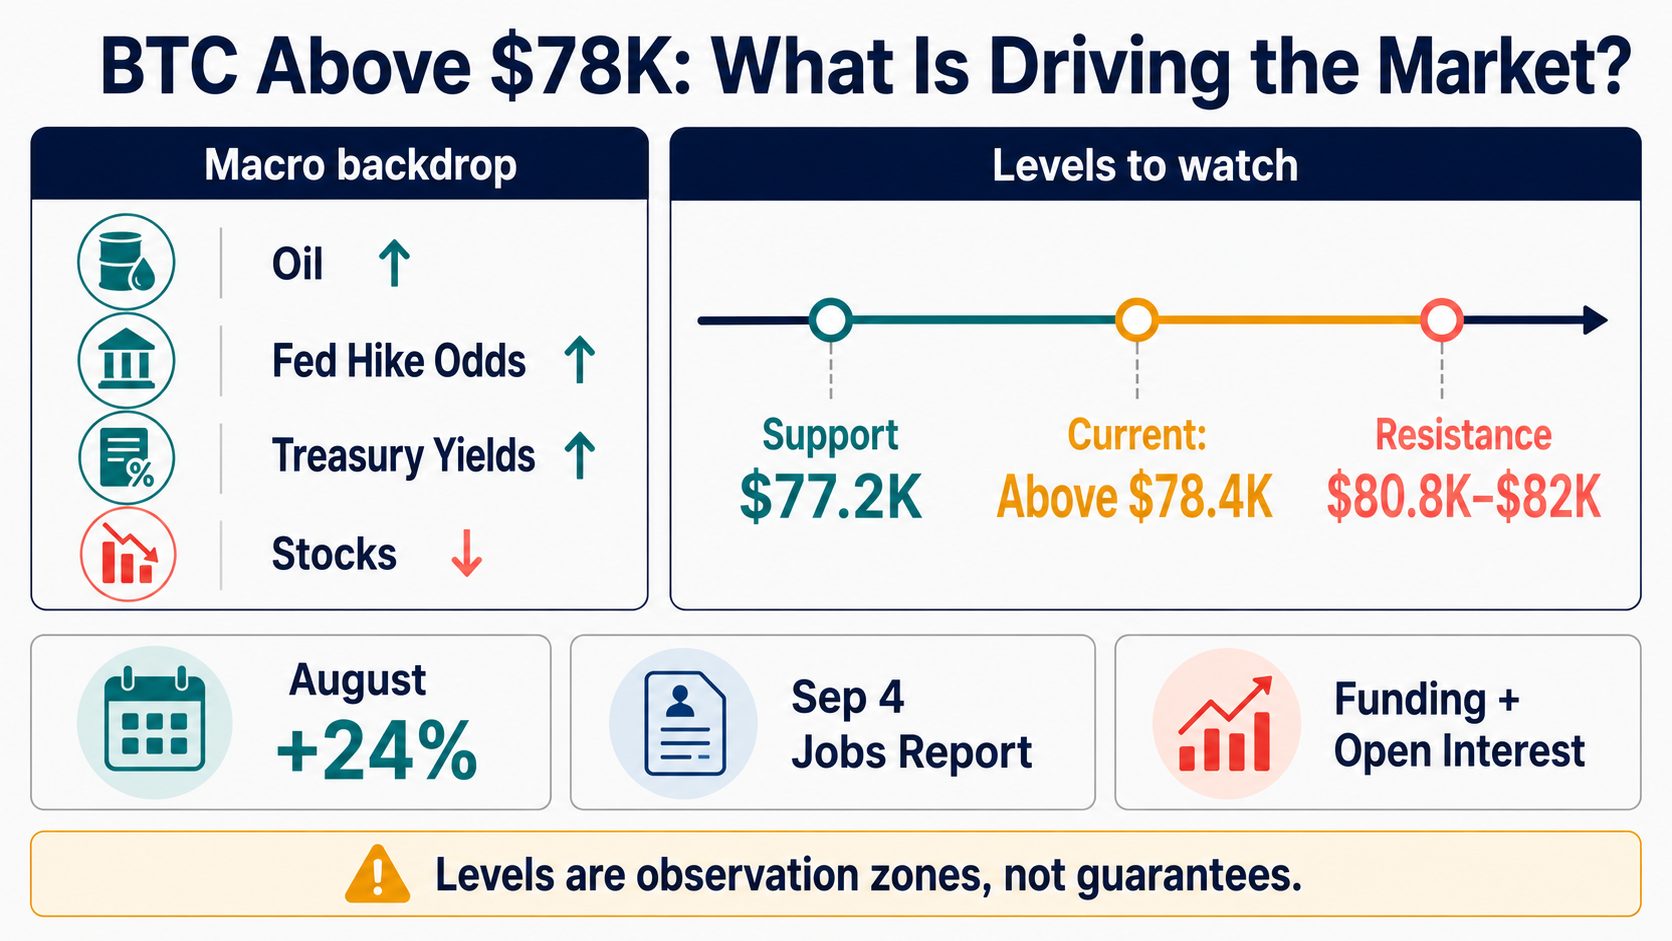
The macro transmission channel begins with energy. Higher oil prices can lift inflation expectations and make central banks less willing to ease policy. Higher expected rates push Treasury yields and the dollar upward, increasing the opportunity cost of holding non-yielding assets and reducing appetite for leveraged risk.
Bitcoin is not mechanically tied to any one of those variables, but liquidity conditions matter. A surprise Fed hike or a sharp repricing in the two-year Treasury yield could pressure leveraged crypto positions. Funding costs can rise, stablecoin liquidity can become more cautious and traders may cut exposure across assets.
The opposite path is also possible. If employment data weakens enough to reduce rate-hike expectations without signaling a severe recession, yields could fall and risk appetite could improve. The September 4 U.S. payroll report is therefore a major catalyst. Tapbit Learn's analysis of Treasury liquidity and Bitcoin's September test provides additional context for that channel.
Bitcoin Support and Resistance Levels to Watch
Immediate Support Around $77,000
The $77,200 area is the nearest observed support zone. A brief move below it is not automatically a breakdown; traders should watch whether price quickly recovers and whether the move occurs on heavy spot selling. Repeated closes below the zone, combined with rising sell volume, would weaken the current resilience thesis.
Resistance Between $79,400 and $80,800
The immediate resistance area is around $80,800-$82,000. CoinDesk noted that the $82,000 level had been rejected repeatedly, so a sustained move above it with credible spot volume would be stronger than a brief futures-driven spike.
Why Traders Should Watch Open Interest and Funding
Open interest shows the amount of outstanding derivatives exposure, while funding helps keep perpetual prices aligned with spot. Rapidly rising open interest and strongly positive funding can indicate that long positions are becoming crowded. If price stops advancing, those positions can become fuel for a liquidation cascade.
Conversely, stable funding and moderate open-interest growth can suggest a more balanced market. Neither measure predicts direction alone, but both help traders judge how fragile a price level may be.
BTC Scenarios Before the September 4 Jobs Report
- Bull case: BTC clears $80,800-$82,000 with sustained spot demand while yields stabilize. A confirmed close above the band would shift attention back to continuation.
- Base case: Bitcoin consolidates between approximately $77,200 and $80,800 as traders wait for U.S. labor data. Range trading may still produce fast liquidation wicks.
- Bear case: Oil and yields rise, the dollar strengthens and $77,200 fails on spot selling. A crowded long position could accelerate the decline.
These are observation frameworks, not guaranteed targets. Traders should invalidate a scenario when the underlying evidence changes rather than defend a level mechanically.
How to Trade BTC-USDT Futures on Tapbit
Tapbit provides BTC-USDT perpetual futures for long or short price exposure. Perpetual contracts use margin and funding; they do not deliver Bitcoin to the trader as a spot purchase would.
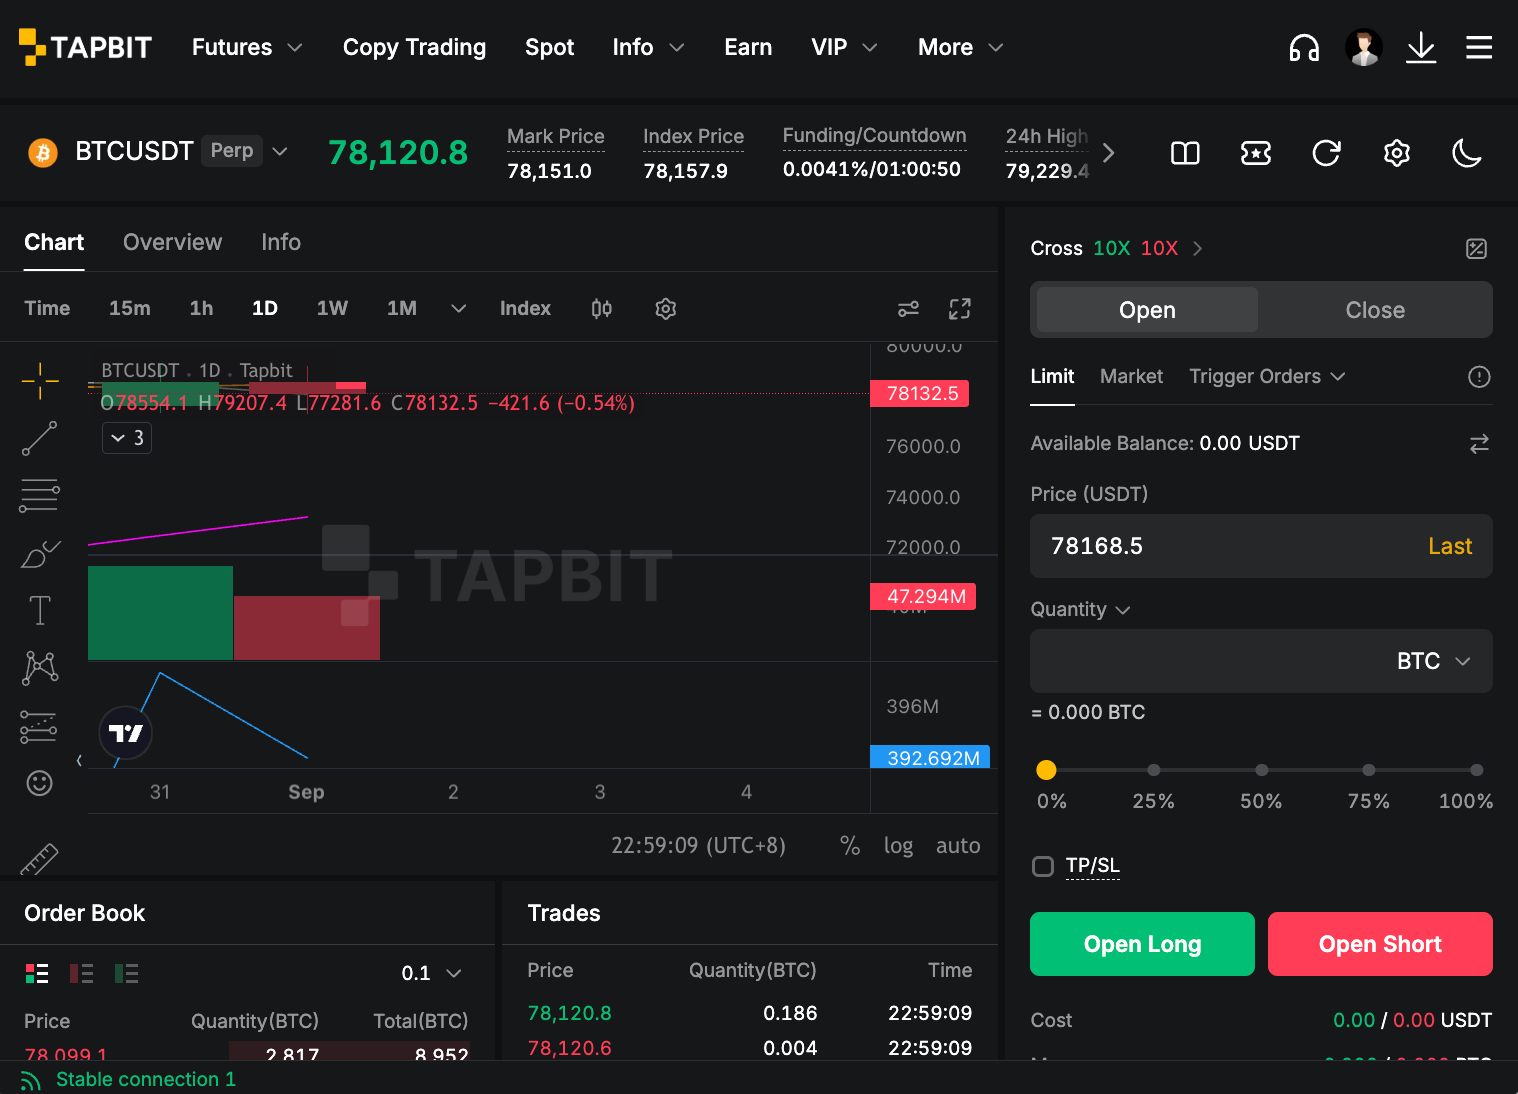
Before entering, choose a position size that can survive normal volatility, review the mark price and liquidation price, and decide the invalidation level in advance. High leverage can turn a small adverse move into a forced liquidation. New users can create a Tapbit account and examine contract details before trading.
Bottom Line
Bitcoin's ability to hold above $78,400 after a 24% August gain is a positive relative-strength signal. It does not remove the macro calendar or leverage risk. The updated map is approximately $77,200 support and $80,800-$82,000 resistance, with spot demand, funding and open interest determining the quality of any move.
FAQ
Why is Bitcoin holding above $78,000?
Bitcoin's roughly 24% August gain, fresh spot demand and renewed Strategy purchases appear to be offsetting some pressure from higher oil prices and tighter rate expectations.
Is Bitcoin acting as a safe haven?
It showed relative resilience in this window, but Bitcoin has also behaved like a high-beta risk asset during liquidity shocks. One session is not enough to prove safe-haven status.
What are the main BTC support and resistance levels?
The immediate observed support is near $77,200. Resistance is concentrated from about $80,800 to $82,000. These are zones, not guarantees.
How could higher oil prices affect Bitcoin?
Sustained high oil can lift inflation expectations, yields and the dollar, potentially reducing liquidity and pressuring leveraged crypto positions.
Where can traders access BTC-USDT futures?
Tapbit offers BTC-USDT perpetual futures. Traders should review funding, margin and liquidation risk before opening a position.


