

Bitcoin price today is trading near $63,860, close to the upper end of its intraday range. The latest market data shows BTC moving between roughly $62,454 and $64,115, which means the recovery is strong enough to matter but still close to an important resistance area.
For traders, the key question is not only “how much is Bitcoin selling for today?” It is whether today’s rise has enough support from flows, market sentiment, and volume to continue. Bitcoin price today is being shaped by ETF demand, broader risk appetite, and the market’s reaction to the $64,000 area.
Quick context table:
| Scenario | What It Means | Signal to Watch |
|---|---|---|
| ✅ Bull case | BTC holds the $63,000–$64,000 zone and attracts fresh demand. | Stronger volume and a sustained move above the intraday high. |
| 🔎 Base case | BTC stays range-bound while traders wait for more ETF and macro data. | Sideways trading near the high-$62,000 to mid-$64,000 area. |
| ⚠️ Bear case | The rebound fades and BTC retests support. | A loss of the $63,000 area and weaker spot demand. |
Bitcoin Price Today: How Much Is BTC Selling For Now?
Start with the live level, then compare it with the recent range and the signals that could confirm or weaken the move.
Current BTC price and daily move
Bitcoin is currently near $63,860. That puts BTC above the intraday low and near the day’s high, showing that buyers stepped in after early weakness. The move is constructive because BTC did not stay near the low-$62,000 area for long.
A price move like this usually attracts two groups of traders. Short-term traders focus on whether momentum can push through the next resistance zone. Longer-term investors look at whether the move confirms renewed demand after a period of weaker sentiment.
Intraday range and short-term momentum
The intraday range is important. BTC has traded from around $62,454 to around $64,115. A wide range shows active positioning, but it also means volatility is high. A strong close near the top of that range would look more constructive than a rejection back below the mid-range.
For a short-term market view, the $63,000–$64,000 area is the center of attention. If Bitcoin holds above this zone, traders may start looking for a follow-through move. If BTC loses it quickly, today’s move may become another failed rebound.
Why the $63K–$64K zone matters
The $63K–$64K area matters because round-number levels often become psychological trading zones. They also attract stop orders, breakout traders, and short-term profit-taking. A move into this zone can look strong on the chart, but confirmation depends on whether buyers defend it after the first push.
Why Is Bitcoin Rising Today?
The drivers below work together, so the cleaner view comes from comparing momentum, liquidity, and risk conditions rather than one headline alone.
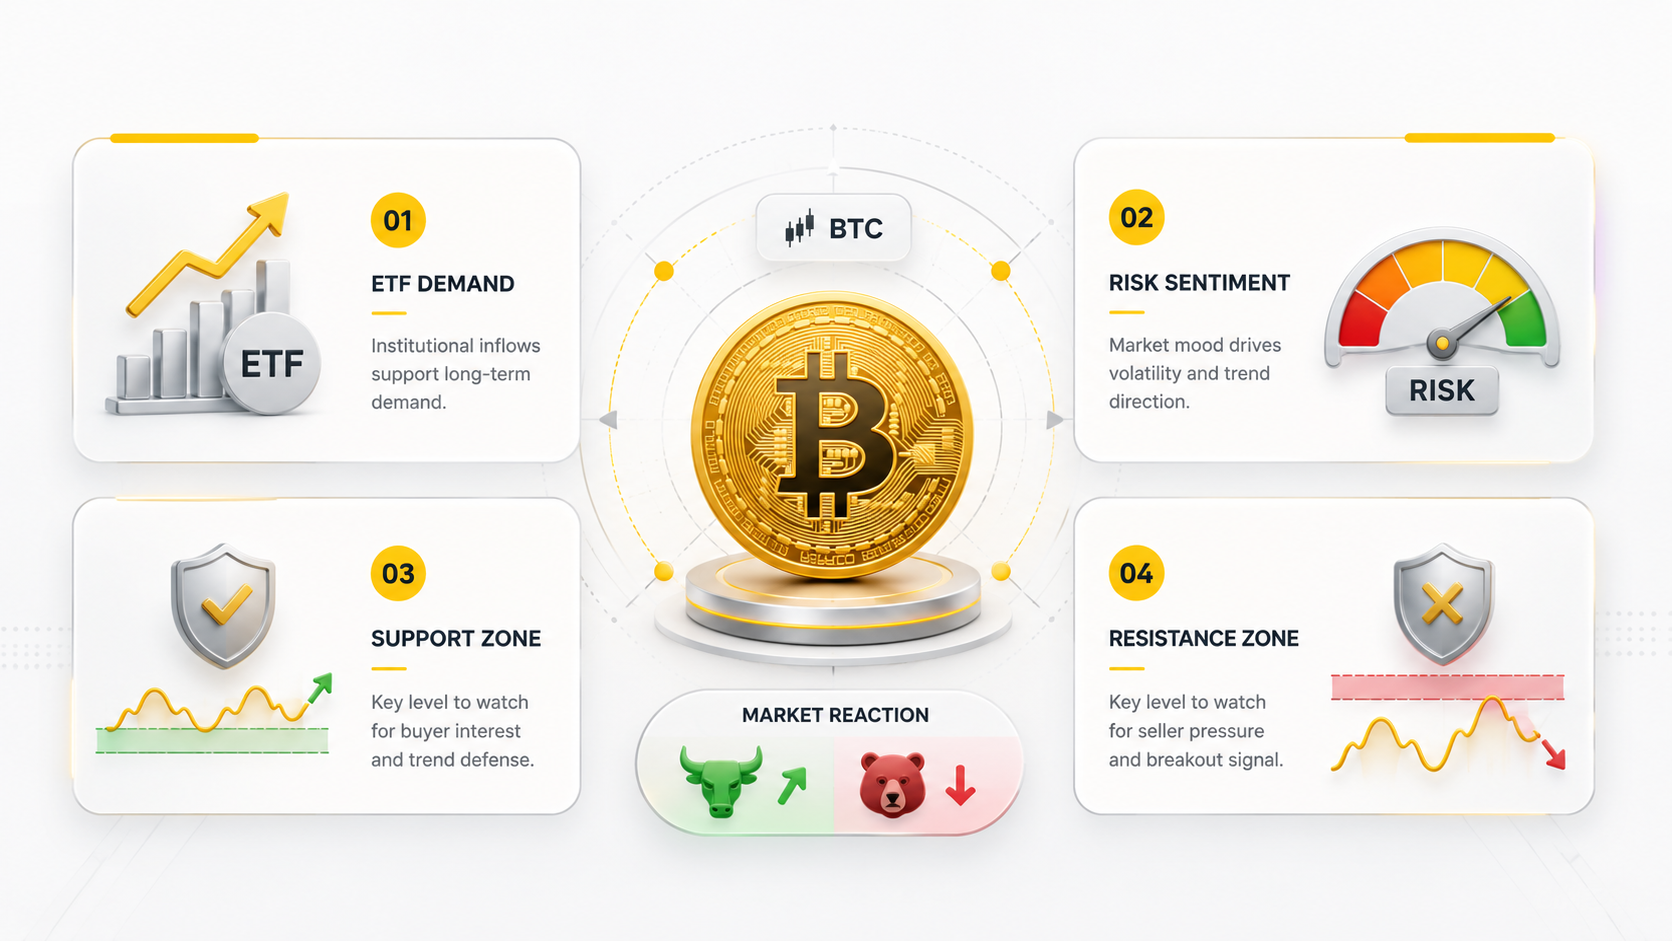
ETF demand and institutional flows
ETF demand remains one of the biggest drivers for Bitcoin. When spot Bitcoin ETF inflows improve, they can support the market by absorbing supply and signaling that institutional demand has not disappeared. Recent reports have pointed to renewed ETF inflows after a period of outflows, which helps explain why buyers are more willing to defend dips.
ETF flows do not guarantee that BTC will rise every day. They are one part of the market structure. But when flows improve while price is trying to reclaim resistance, the signal becomes more important.
Risk sentiment across crypto and tech assets
Bitcoin also trades as a risk asset. When tech stocks, semiconductor stocks, and broader equity indexes rebound, crypto traders often read that as a sign that speculative appetite is improving. That does not mean Bitcoin is the same as a stock index, but the market often treats BTC as part of the broader risk cycle.
If risk appetite stays firm, Bitcoin can benefit. If markets turn defensive again, BTC may lose support even if its long-term narrative remains intact.
Dollar, rates, and macro pressure
Macro pressure still matters. Higher real yields, a stronger dollar, oil shocks, or renewed geopolitical stress can all reduce demand for volatile assets. That is why Bitcoin can rally on ETF demand and still face resistance if macro conditions turn unfriendly.
For today, the better risk tone has helped BTC, but the move still needs confirmation.
Why Could Bitcoin Drop Again?
The drivers below work together, so the cleaner view comes from comparing momentum, liquidity, and risk conditions rather than one headline alone.
Failed breakout risk
The clearest risk is a failed move above the current zone. If Bitcoin pushes above $64,000 but cannot hold there, short-term traders may reduce exposure quickly. This can pull BTC back toward the mid-$63,000 area or even the low-$62,000s.
ETF inflow slowdown
A slowdown in ETF inflows would also weaken the bullish case. If buyers expected strong institutional demand but new flow data disappoints, BTC could lose one of its main support narratives.
Macro shock or liquidity pullback
A sudden shift in macro sentiment can also hit Bitcoin. Rising yields, a stronger dollar, or renewed risk-off pressure can reduce leverage and push traders into safer assets.
Bitcoin Price Forecast: Bull, Base, and Bear Scenarios
Start with the live level, then compare it with the recent range and the signals that could confirm or weaken the move.
Bull case
In the bullish scenario, Bitcoin holds above the $63,000–$64,000 zone, volume stays healthy, and ETF inflows remain positive. A sustained move above the day’s high around $64,115 would make traders watch the next resistance area.
Base case
In the base case, BTC stays range-bound. It may trade around the high-$62,000 to mid-$64,000 area while traders wait for stronger ETF flow data or a clearer macro signal. This would not be bearish by itself, but it would delay a clean breakout.
Bear case
In the bearish scenario, BTC fails near resistance and loses the $63,000 area. A move back toward $62,454, the intraday low, would show that buyers are not yet strong enough to control the short-term trend.
What Confirms or Invalidates the BTC Move?
The points below break the topic into the main signals readers should review before drawing a conclusion.
Confirmation signals
A stronger Bitcoin setup would include a close near the top of the intraday range, improving ETF inflows, higher spot volume, and stable risk sentiment across tech and crypto assets.
Invalidation signals
The move becomes weaker if Bitcoin loses the $63,000 area, ETF flows turn negative again, or risk assets sell off. A failed move near $64,000 would also warn that buyers are not ready to extend the rally.
What traders should watch next
Traders should watch BTC price, ETF flows, volume, funding conditions, and macro signals together. One data point is rarely enough. Before trading, users can review the BTC spot market, compare it with the BTC futures market, and create an account only after understanding the risks of spot and leveraged trading.
For more context, readers can compare this topic with Bitcoin ETF inflows, why Bitcoin is up today, and Bitcoin dominance.
FAQ
The points below break the topic into the main signals readers should review before drawing a conclusion.
How much is Bitcoin selling for today?
Bitcoin is trading near $63,860, though the price changes continuously during the day.
Why is Bitcoin rising today?
Bitcoin is rising as traders react to stronger risk sentiment, renewed ETF demand, and buying interest near the low-$62,000 area.
Why could Bitcoin drop again?
BTC could drop if it fails to hold near $64,000, ETF inflows slow, or macro conditions turn risk-off again.
How much will 1 Bitcoin be worth in 2030?
No one can know with certainty. Long-term Bitcoin value depends on adoption, supply dynamics, regulation, macro liquidity, and investor demand.
Is Bitcoin futures trading the same as owning BTC?
No. Futures trading gives price exposure through a derivative contract. It is not the same as owning BTC in a spot wallet and can involve leverage and liquidation risk.


