

Buying the dip is a great strategy—until the trend shifts. If you have been trading the crypto markets over the last few weeks, you have likely noticed that stepping in to catch every red candle is getting expensive.
In a choppy or downward-trending market, what looks like a recovery is often just a trap. Before you allocate capital to a bounce, you need to know how to differentiate a genuine market bottom from a temporary pause in a larger sell-off. You need to understand the Bear Flag.
Right now, major assets are flashing this exact technical setup. Here is the desk’s breakdown of what a bear flag actually is, how it is currently playing out on the Bitcoin and Ethereum charts, and the strict rules you need to trade it without getting chopped up.
The Mechanics of a Bear Flag
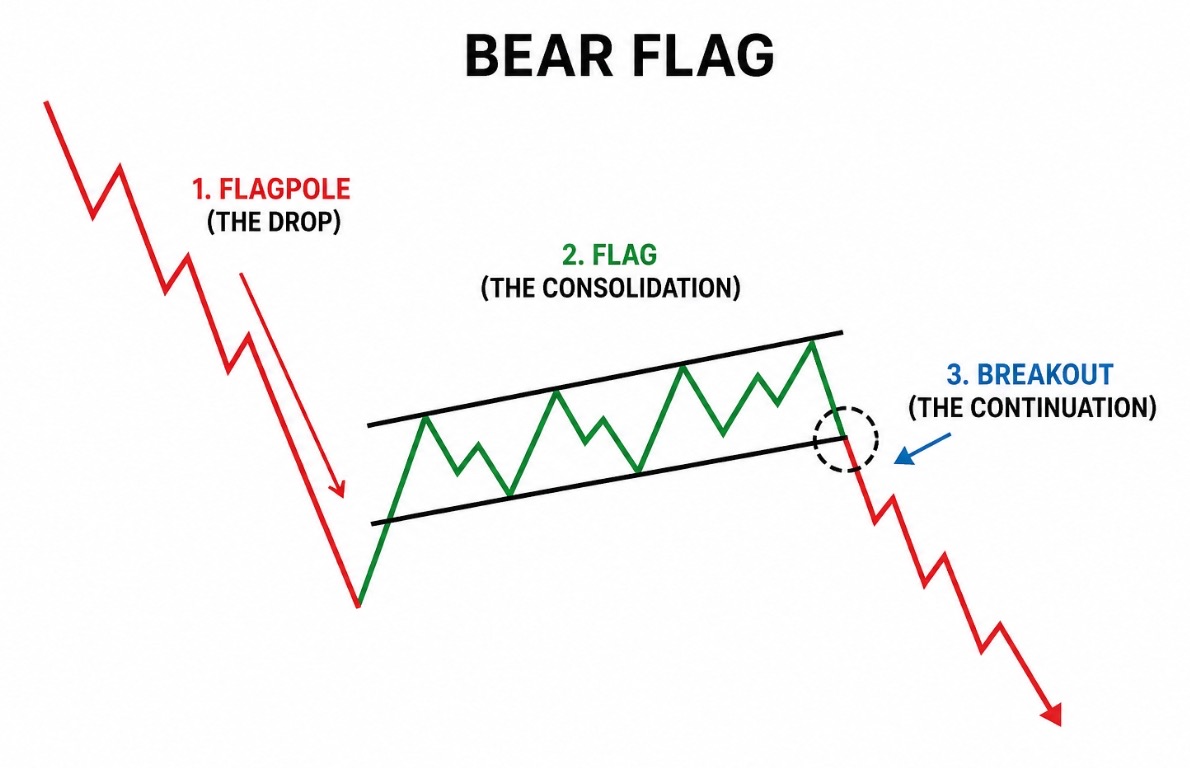
A bear flag is a "trend continuation" pattern. It signals that the market just took a heavy hit, and the current sideways or slightly upward price action is just the market catching its breath before the next leg down.
It breaks down into three distinct phases:
-
The Flagpole (The Drop): A steep, high-volume price decline. This is the initial flush where sellers overwhelm the order book.
-
The Flag (The Consolidation): After the initial drop, the price enters a tight, slightly upward-sloping channel. Volume dries up. Retail traders see the green candles and assume the bottom is in. Professional traders recognize this as low-volume exhaustion.
-
The Breakout (The Continuation): The price pierces the lower support line of the flag, selling volume spikes again, and the downward trend resumes.
The 2026 Tape: BTC and ETH in the Crosshairs
We aren't just talking about chart theory. The bear flag is actively dictating the Q2 2026 market structure.
Bitcoin's Range-Bound Struggle If you pull up the BTC chart on TradingView right now, the pattern is clear. Following the heavy macro flush earlier this year (the flagpole), Bitcoin has been stuck in a corrective channel. It has repeatedly tested support around the $62,000 level while struggling to break through heavy supply near $80,000. Market technicians are monitoring this prolonged consolidation closely. If Bitcoin loses the bottom trendline of this channel on high volume, the measured move suggests a rapid repricing downward. Until that $80,000 resistance breaks cleanly, this remains a bearish continuation setup.
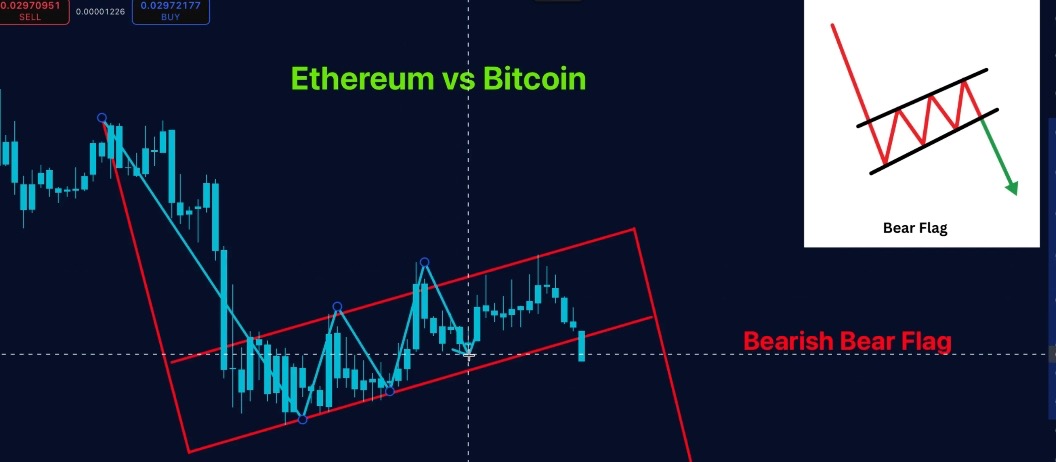
Ethereum's Relative Weakness You can see an identical setup on the ETH/BTC trading pair. As noted in recent Cointelegraph market data, Ethereum network staking rates hit an all-time high of 32.33% this month. Normally, locking up that much supply is extremely bullish. Yet, the ETH/BTC ratio has been printing a textbook bear flag since February. The chart shows a sharp drop followed by an agonizingly slow, low-volume upward drift. A break below this flag's support indicates further devaluation of ETH against BTC, regardless of the strong on-chain staking fundamentals.
The Tapbit Playbook: Execution Rules
You don't trade a bear flag on a gut feeling. You wait for the market to prove the setup. Here is how the desk manages the trade:
-
Wait for the Candle Close: Never short a bear flag while the price is still bouncing inside the channel. Wait for a decisive 1-hour or 4-hour candle to close below the lower support line. Market makers use wicks to trigger premature shorts; wait for the body of the candle to close.
-
Check the Volume Profile: A valid setup requires volume to steadily decline while the flag is forming, showing a lack of real buyer interest. The moment the price breaks support, volume should expand noticeably. If the price breaks down but volume is flat, it is likely a fake-out.
-
Use Fibonacci Limits: Pull your Fibonacci retracement tool across the initial Flagpole. A high-probability bear flag should not retrace more than the 38.2% to 50% level. If the price climbs higher than the 50% mark, the bearish momentum is fading. Scrap the chart and look for a new setup.
-
Determine the Measured Move: To find a logical take-profit zone, measure the vertical height of the initial Flagpole drop. Project that exact same distance downward, starting from the point of the breakout. This gives you a data-driven exit target rather than guessing where the bottom might be.
Risk Control: Surviving the Bull Trap
Crypto liquidity is unforgiving. The primary risk when trading this pattern is getting caught in a Bull Trap.
In low-liquidity environments, the price will often push just above the upper resistance line of the flag. This tricks breakout traders into going long and triggers the stop-losses of early short-sellers. Once that liquidity is cleared, the price reverses hard back into the bearish trend.
The Defense: Never enter a short without a hard stop-loss. Place your stop slightly above the upper resistance line of the flag, or just above the most recent "lower high" inside the channel. If the price legitimately breaks and holds above that line, your thesis is invalidated. Take the small paper cut and move on.
The Bottom Line
The bear flag is a reality check. It forces you to look at the higher timeframe trend instead of getting chopped up on the 15-minute chart.
If the current market structures on Bitcoin and Ethereum break downward, you need to be positioned properly. Log in to your Tapbit terminal to map out your Fibonacci levels and set your conditional orders. If you are looking for an execution platform with deep liquidity and zero downtime during high-volatility events, register your Tapbit account today.
Frequently Asked Questions: Trading the Bear Flag Pattern
What exactly is a bear flag?
Cut through the chart jargon—it is a "trend continuation" pattern that happens during a broader market sell-off. Think of it as a brief rest stop for exhausted sellers. It starts with a violent drop (the flagpole), followed by a slow, low-volume upward bounce (the flag). Once that weak buying pressure dries up, the asset breaks downward to resume the crash.
How do I know I'm looking at a bear flag and not a genuine market bottom?
The secret is in the volume profile and the Fibonacci levels. Genuine market bottoms and trend reversals are characterized by an explosion of buying volume. A bear flag features declining volume as the price slowly ticks up. Furthermore, if you pull a Fibonacci retracement tool across the initial drop, the bounce should absolutely not cross the 50% line. If it goes higher than 50%, the bears have lost control and the pattern is invalidated.
When is the exact moment I should open my short position?
Patience is your best defense here. Never short while the price is still chopping around inside the flag's channel. You must wait for a high-timeframe candle (like the 1-hour or 4-hour) to physically close below the bottom support line. Market makers love to push the price down briefly just to leave a "wick" and trap early shorters. Wait for the definitive candle close.


