

Bitcoin remained close to $64,000 after the Federal Reserve decision, leaving traders with a market that is stable on the surface but still undecided underneath. Based on the supplied Tapbit snapshot, BTC/USDT was trading near $64,442, down about 0.52% over 24 hours, with a session high of $65,394.12 and a low of $63,943.29.
The price response matters because Federal Reserve meetings can change expectations for interest rates, liquidity, the US dollar, and investor demand for risk assets. Bitcoin did not immediately break down after the decision, but it also failed to establish a convincing recovery above nearby resistance. That combination points to consolidation rather than a confirmed bullish reversal.
For short-term traders, the central question is whether the $63,900-$64,000 area can continue absorbing selling pressure. For medium-term investors, the more important issue is whether improving liquidity conditions, institutional demand, and spot ETF flows can offset the pressure created by restrictive financial conditions.
BTC/USDT Price After the Fed Decision
The supplied Tapbit chart shows Bitcoin trading inside a relatively narrow 24-hour range. A daily decline of around 0.52% is modest compared with the sharp moves frequently seen around major macroeconomic events. This suggests that neither buyers nor sellers gained decisive control immediately after the announcement.
The 24-hour trading range between approximately $63,943 and $65,394 is now the first technical zone to monitor. Price action near the lower boundary shows whether buyers are willing to defend $64,000, while repeated rejection near the upper boundary would confirm that sellers remain active above $65,000.
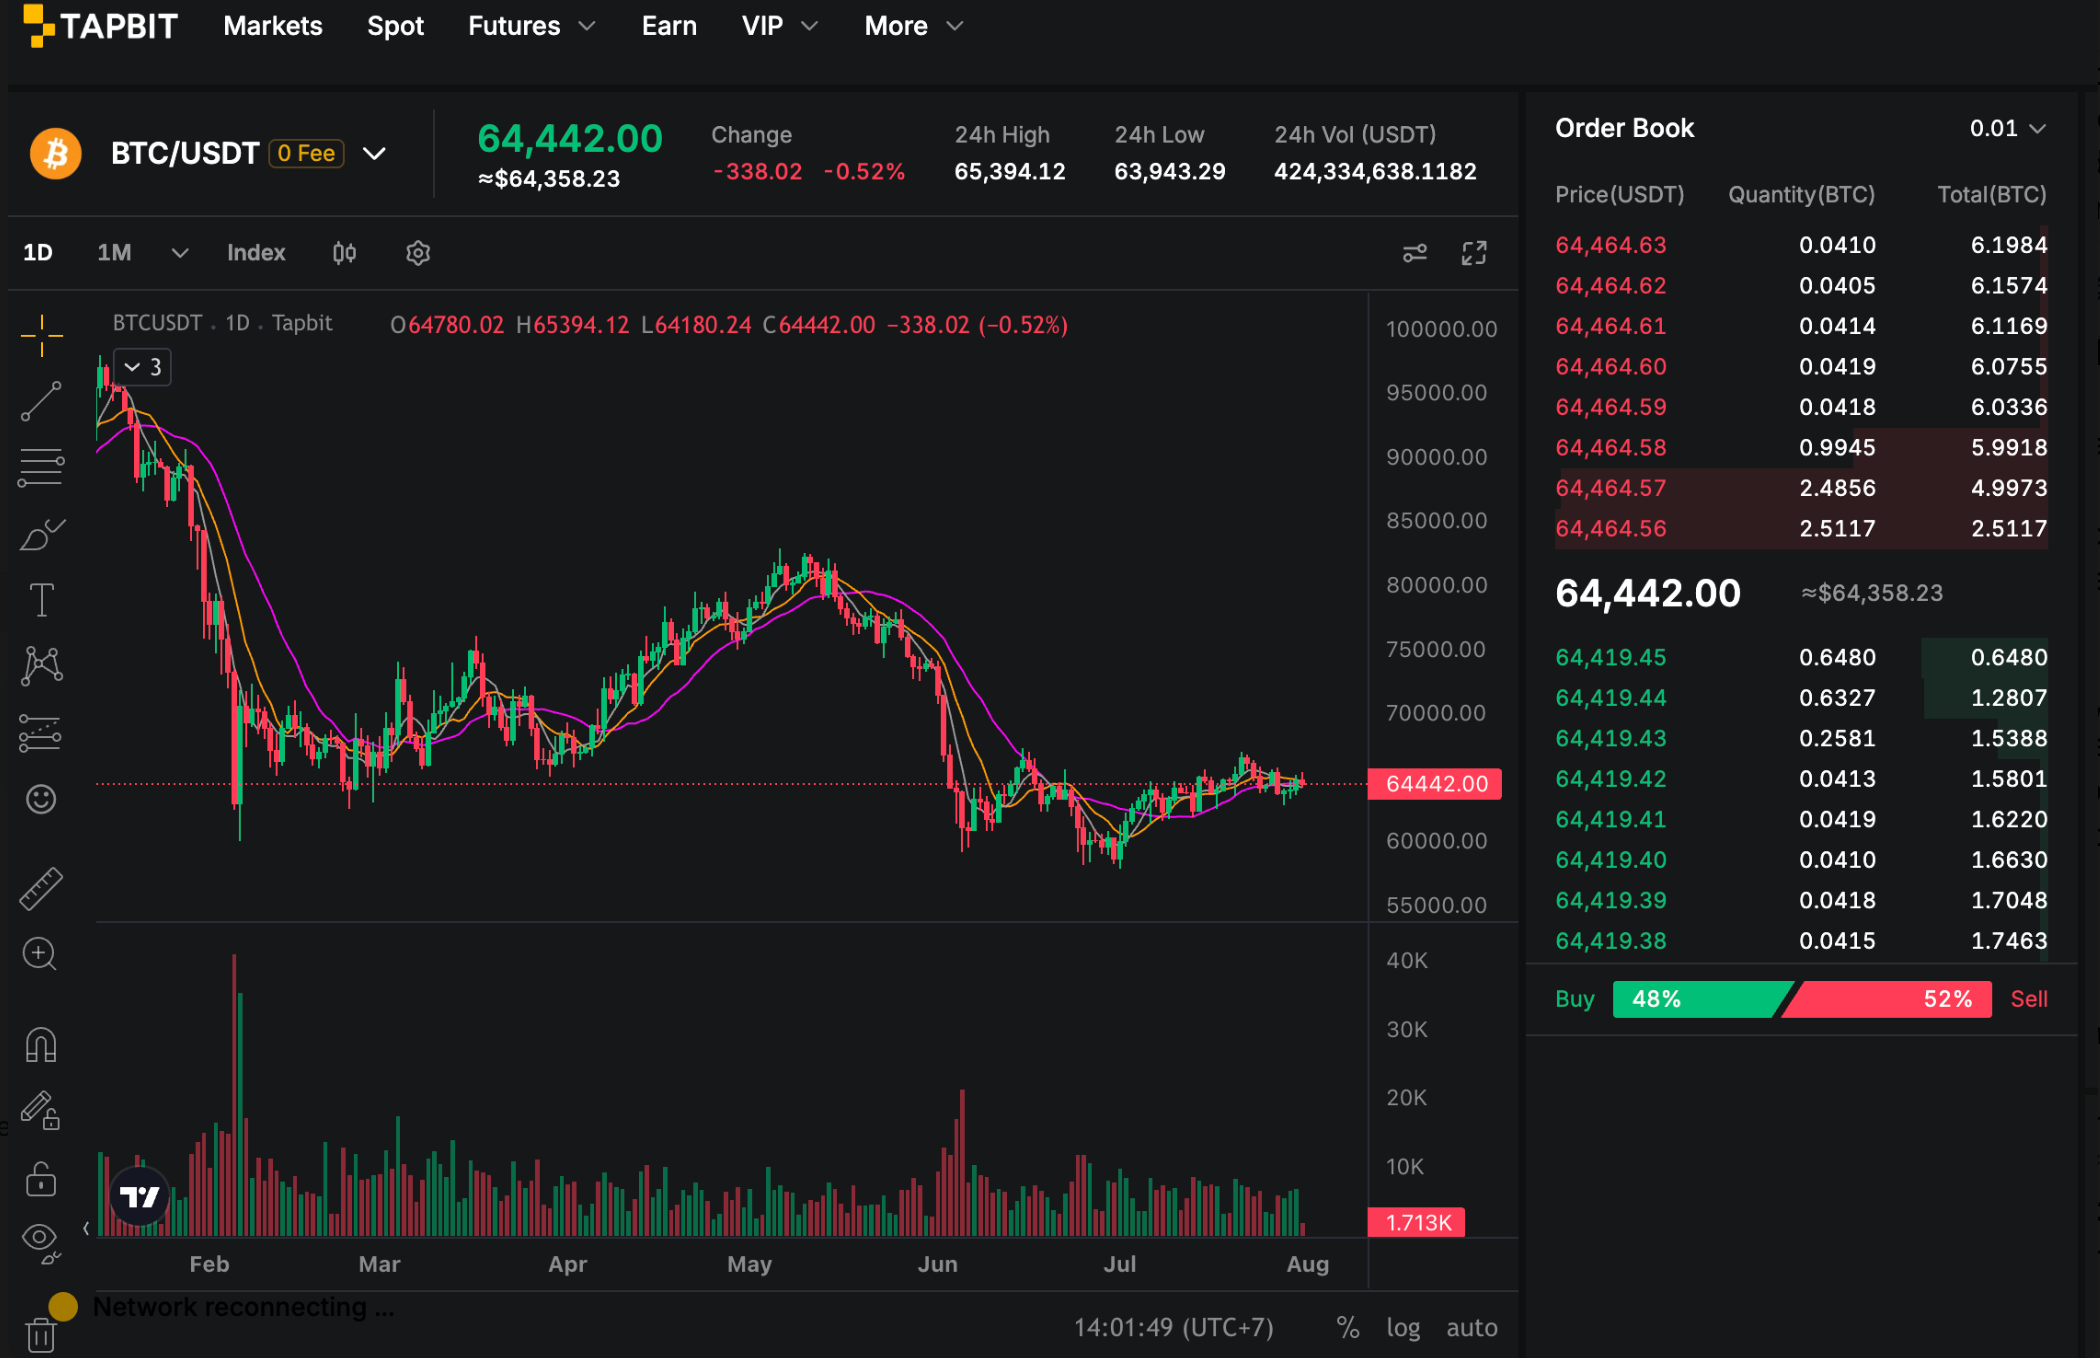
Trading volume exceeded $424 million in the supplied market snapshot. Volume alone does not identify direction, but it helps judge the quality of a move. A breakout above $65,400 accompanied by expanding volume would carry more weight than a brief low-volume spike. The same logic applies to a breakdown below $63,900: strong selling volume would make a move toward lower support more credible.
Why the Federal Reserve Decision Matters for Bitcoin
Federal Reserve policy affects Bitcoin through several connected channels. Higher interest rates raise the return available on cash and short-duration government debt, which can reduce demand for volatile assets. Restrictive policy may also strengthen the US dollar and tighten financial conditions, creating a more difficult environment for crypto, growth stocks, and other liquidity-sensitive markets.
A softer policy outlook can have the opposite effect. If investors expect inflation to cool and future rates to decline, the market may begin pricing in easier liquidity before an actual rate cut occurs. Bitcoin often reacts to that change in expectations because it trades continuously and is highly sensitive to shifts in global risk appetite.
However, the first move after a Fed decision can be misleading. Markets may initially respond to the headline rate decision and then reverse as traders study the policy statement, inflation language, economic projections, and the chair's press conference. That is why confirmation over the following sessions is more useful than interpreting a single intraday candle as a lasting trend.
Bitcoin Market Structure Near $64K
The broader chart in the supplied image shows Bitcoin recovering from a recent low near the upper-$50,000 area, but the rebound has so far struggled to produce a sequence of strong higher highs. Price is moving around short-term trend lines instead of accelerating away from them, which is typical of a market waiting for a new catalyst.
The $64,000 region is psychologically important because round-number levels tend to concentrate limit orders, stop-losses, and leveraged positions. Holding above it would keep the recent recovery structure intact. Losing it repeatedly would indicate that buyers are becoming less willing to absorb supply at current prices.
Momentum also appears mixed. Bitcoin is no longer falling with the same force seen during the previous selloff, but the lack of a decisive move above $65,400 means the market has not yet converted stabilization into a confirmed uptrend. In practical terms, the price is compressing between support and resistance.
BTC/USDT Support and Resistance Levels
| Level | Market Role | What Would Confirm It |
|---|---|---|
| $63,900-$64,000 | Immediate support and lower edge of the supplied 24-hour range | Repeated daily closes above the zone and improving buy volume |
| $62,000 | Secondary support if the current range fails | Price stabilizes after a breakdown without accelerating toward $60,000 |
| $60,000 | Major psychological and structural support | Strong spot demand and a rapid recovery after any test |
| $65,400 | Near-term resistance based on the latest 24-hour high | A sustained breakout supported by stronger volume |
| $66,000-$68,000 | Recovery zone and next test of bullish momentum | Higher lows form after the breakout instead of an immediate rejection |
Bullish Scenario for BTC/USDT
The bullish scenario begins with Bitcoin continuing to defend $63,900-$64,000 and then reclaiming $65,400. A convincing breakout would ideally occur with rising spot volume, firmer demand in the order book, and follow-through during the next daily session. That would reduce the risk that the move is only a short squeeze.
If BTC establishes support above $65,400, the next recovery area sits around $66,000-$68,000. Clearing that zone would strengthen the case that the correction has matured into a broader recovery. Improving spot ETF flows, a weaker dollar, softer inflation data, or lower market interest-rate expectations could all support this outcome.
The strongest bullish signal would not be a single large green candle. It would be a breakout followed by a controlled pullback that holds above former resistance. That pattern would show that buyers are willing to defend higher prices and that market structure is improving.
Bearish Scenario for BTC/USDT
The bearish scenario develops if Bitcoin closes decisively below $63,900 and fails to recover the level quickly. Such a move would weaken the current range and shift attention toward $62,000. If selling pressure remains heavy there, the market could retest the psychologically important $60,000 area.
Macro conditions could intensify the downside. A stronger US dollar, rising bond yields, persistent weakness in technology shares, or renewed ETF outflows would make it harder for Bitcoin to attract fresh demand. Leveraged long positions can also amplify a decline if falling prices trigger liquidations.
Traders should distinguish between a brief liquidity sweep and a genuine breakdown. A temporary move below support followed by a rapid recovery is less bearish than several daily closes below the same level. Duration, volume, and the ability to reclaim lost support are therefore essential confirmation tools.
ETF Flows, the Dollar, and Liquidity Signals to Watch
Bitcoin's next move will probably depend on more than chart levels. Spot ETF flows provide a useful window into institutional demand, especially when inflows or outflows persist for several sessions. Consistent inflows can absorb market supply, while sustained outflows may reinforce resistance during weak periods.
The US Dollar Index and Treasury yields are also relevant. Bitcoin does not move inversely to the dollar every day, but a strengthening dollar often coincides with tighter global financial conditions. Falling yields and a softer dollar would generally improve the environment for liquidity-sensitive assets, although neither signal guarantees a rally.
Crypto-specific indicators matter as well. Traders can monitor funding rates, open interest, liquidation clusters, and the difference between spot and derivatives activity. Rising open interest without comparable spot demand can make a rally fragile because it may depend too heavily on leverage.
How to Read Volume and Order-Book Activity
Volume should be interpreted in context. High volume during a breakout suggests broad participation, but high volume during a rejection can signal aggressive distribution. Traders should compare the size of buying and selling activity with the location of price inside the current range.
Order-book data can show where liquidity is concentrated, but visible orders can be changed or canceled. It is therefore better used as a short-term market map than as proof that support or resistance will hold. Executed trades and the market's reaction to large orders are usually more informative than displayed liquidity alone.
The supplied snapshot showed a nearly balanced short-term order-book split. That balance is consistent with consolidation: buyers are active enough to defend the range, but sellers continue to limit upside progress. A sustained imbalance accompanied by price expansion would provide a clearer directional signal.
How to Follow BTC/USDT on Tapbit
Traders can monitor price action, volume, recent trades, and order-book changes through the BTC/USDT spot market on Tapbit. The market page can help users compare live execution data with the support and resistance zones discussed above.
Market data should support a trading plan rather than replace one. Before entering a position, users should define invalidation levels, consider position size, and avoid treating a single indicator as a guaranteed signal. This is particularly important after central-bank events, when volatility can return quickly.
BTC/USDT Price Outlook
Bitcoin holding near $64,000 after the Fed decision shows that buyers have not abandoned the market, but it does not yet confirm a bullish breakout. The clearest short-term signal will come from a sustained move outside the $63,900-$65,400 range.
Above $65,400, the outlook would improve and the market could challenge $66,000-$68,000. Below $63,900, downside risk would increase toward $62,000 and potentially $60,000. Until one side wins that contest, range trading and false breakouts remain likely.
Professional analysis in this environment should remain conditional. Rather than predicting one outcome with certainty, traders can prepare for both scenarios and update their view as price, volume, ETF flows, yields, and the dollar provide new evidence.
Risk Disclaimer
This article is for informational purposes only and does not constitute financial advice. Cryptocurrency prices are highly volatile, and support or resistance levels can fail without warning. Users should conduct independent research, manage position size carefully, and understand the additional liquidation risk associated with leverage.
FAQ
Why is Bitcoin holding near $64K?
Bitcoin is consolidating while traders assess Federal Reserve policy, liquidity expectations, ETF flows, the US dollar, and broader risk sentiment. Buyers are defending the current range, but they have not yet forced a confirmed breakout.
What is the main BTC support level?
The immediate support area is approximately $63,900-$64,000 based on the supplied market snapshot. If that zone fails on strong volume, $62,000 and $60,000 become the next areas to monitor.
What resistance must Bitcoin break?
BTC/USDT needs to clear roughly $65,400 and hold above it. A move into the $66,000-$68,000 zone with sustained spot demand would provide stronger evidence of improving momentum.
Is the Fed decision bullish for Bitcoin?
Not automatically. The effect depends on the policy message, future rate expectations, bond yields, dollar strength, and how investors interpret incoming inflation and labor-market data.
Can Bitcoin fall back to $60,000?
Yes. A decisive loss of $63,900 followed by weakness at $62,000 could expose $60,000. This is a risk scenario, not a guaranteed forecast.
Is BTC/USDT breaking out now?
Based on the supplied chart, Bitcoin is still consolidating. A confirmed breakout requires price to leave the current range and sustain the move with stronger participation.


