
Walk onto any trading floor, and you'll see the same mistake happen every single cycle. A massive bull run stretches out, the retail crowd gets severe FOMO and keeps smashing the buy button, while the smart money quietly unloads their bags into the liquidity.
Catching that exact moment when a trend dies—the pivot from optimism to pure selling pressure—is how you protect your capital. You don't guess the top. You wait for the chart to tell you the buyers are exhausted.
One of the cleanest, most reliable footprints of this exhaustion is the Bearish Hammer (which covers both the Shooting Star and the Hanging Man). But let's be real: most traders get absolutely wrecked trying to trade these because they jump the gun. Here is how our desk actually reads the wick, filters out the noise, and executes the short.
The Wick is the Story
Stop looking at just the color of the candle and start looking at the battle it represents. A bearish hammer is the physical evidence of a violent intraday tug-of-war. You are looking for a tiny real body and a massive shadow (wick) that is at least twice the length of that body.
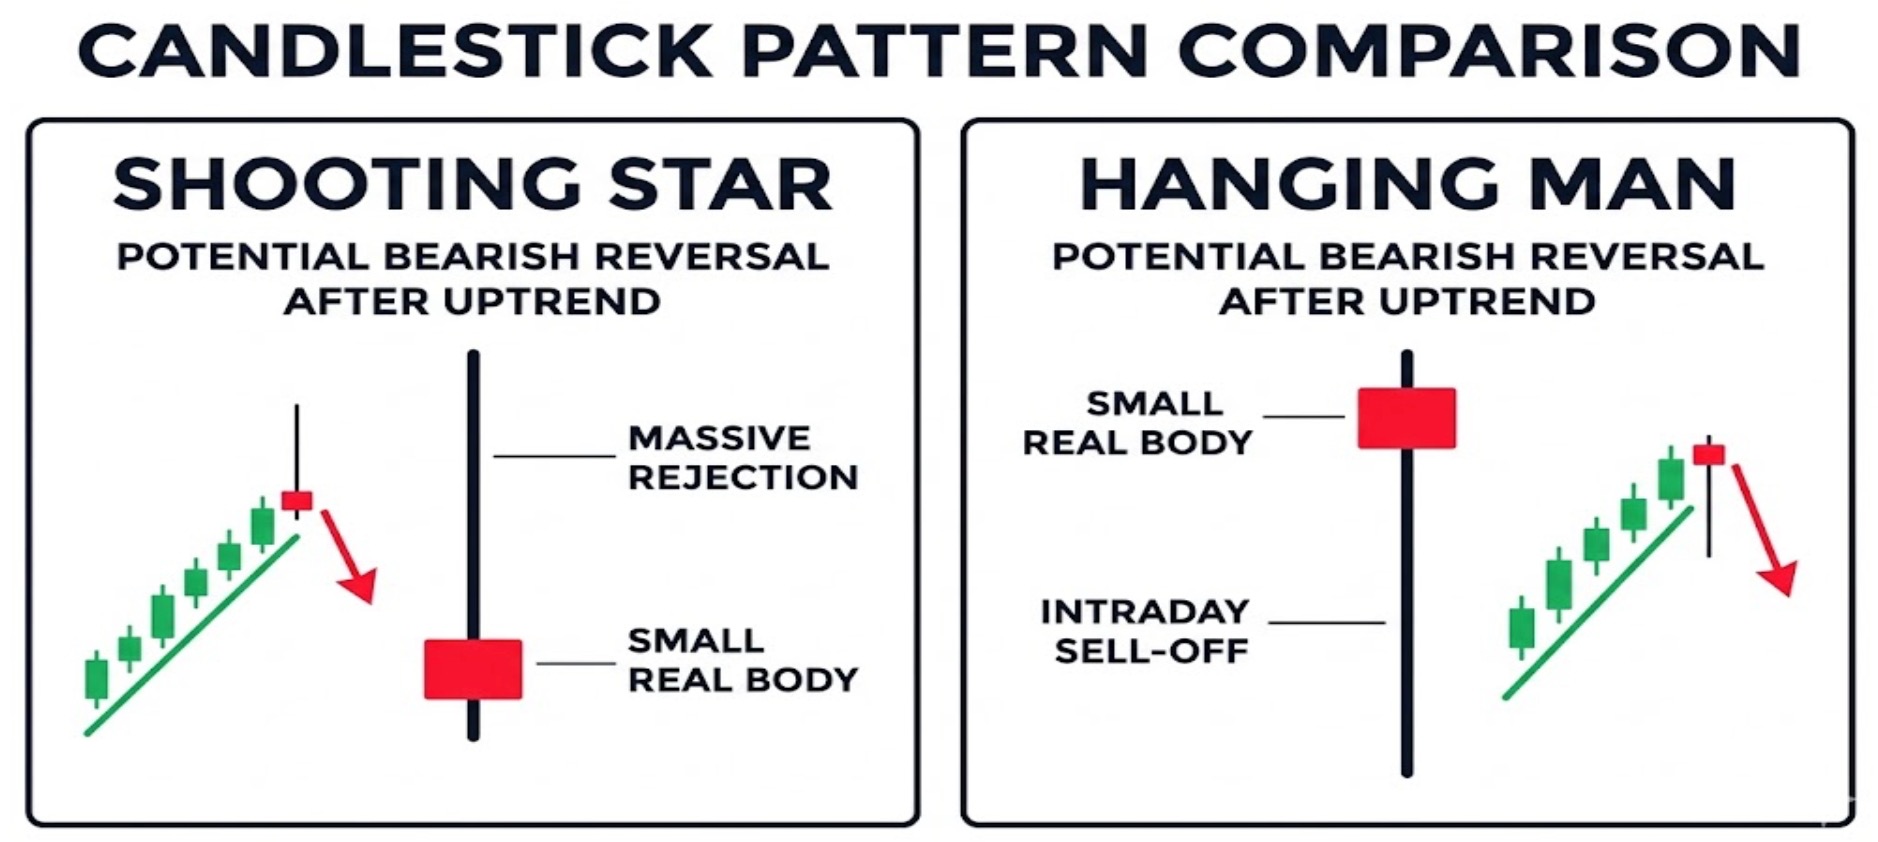
There are two setups you need to burn into your brain:
-
The Shooting Star (Inverted Hammer): This is the classic "failed breakout." It forms at the peak of a rally. Buyers aggressively pushed the price to a new high, thought they had it in the bag, and then sellers completely hijacked the session, slamming the price back down near the open. It’s a total rejection of higher prices.
-
The Hanging Man (Standard Hammer Shape): This also prints at the top of a rally, but the massive wick points down. This means a sudden, violent sell-off happened intraday. Sure, the bulls managed to buy the dip and drag the price back up before the close, but the structural damage is done. The bears just proved they have the ammo to tank the price. The uptrend is now walking on thin ice.
Desk Tip: We don't obsess over whether the tiny body is green or red, but a red body definitely gives you more conviction. It proves the sellers didn't just reject the high—they actually forced the session to close lower than it opened.
Context is Everything (Don't Trade in a Vacuum)
Here is where rookies lose their shirts: they see a long wick in the middle of a sideways chop zone and instantly go short.
A hammer means absolutely nothing without the right context.
If you spot a shooting star after a relentless, multi-day uptrend, pay attention. If you see that exact same shape at the bottom of a brutal downtrend, it’s actually a bullish signal telling you the sellers are exhausted.
To filter out the garbage setups, you need to overlap the pattern with hard resistance. We want to see that shooting star print exactly when the price taps a major psychological round number, a previous swing high, or a heavy level like the 200-day moving average. If the rejection happens at a level where you already expected sellers to be waiting, the win rate goes up drastically.
The Execution Playbook
You’ve got a shooting star. It’s sitting right on major resistance. Do you hit market sell right now? No.
You wait for the setup to confirm. Here is the strict rulebook we use to stay out of traps:
-
Wait for the Close: You do not short the wick while the candle is still open. You wait for the next candle to close cleanly below the absolute lowest point of your bearish hammer. Crunch the numbers: historical data shows that waiting for this single confirmation candle filters out over 30% of fake-outs.
-
Stack the Deck (Confluence): Naked price action is risky. We want other indicators screaming the same thing. Is the RSI historically overbought (pushing 70+)? Did that massive wick form on a huge spike in volume, proving institutions were dumping? If volume is dead, it might just be a brief pause, not a reversal.
-
Set Your Line in the Sand: Enter your short the second that confirmation candle closes. Your stop-loss goes immediately above the very tip of the hammer’s wick. No mental stops. Not giving it "room to breathe." If the price breaks above that wick, your trade thesis is invalid. Get out.
If you can't get a 1:2 risk-reward ratio on the setup (meaning your profit target at the next support level is at least double what you are risking to your stop-loss), skip the trade. There is always another setup tomorrow.
Ready to trade the next major reversal?
-
New to the desk? Register on Tapbit today and claim your welcome rewards.
-
Ready to execute? Log in to Tapbit and pull up your charts.
-
Track live order flow and deep liquidity directly on the Tapbit Homepage.
Frequently Asked Questions (FAQ)
If I see a Shooting Star and a Hanging Man, which one is the better short?
We almost always prefer the Shooting Star. It’s a much more aggressive visual of sellers crushing a breakout. The Hanging Man shows weakness, but the fact that buyers still managed to bid it back up into the close means they aren't completely dead yet.
Can I scalp these patterns on a 5-minute chart?
A: You can, because price action is fractal, but be prepared for a lot of noise. Lower timeframes are notorious for stop-hunts and low-liquidity manipulation. We highly recommend sticking to the 4-hour, Daily, or Weekly charts. Those wicks tell the true story of macro capital flows.
Why did my last Shooting Star trade fail?
A: 90% of the time, it's one of two reasons. Either you shorted it in a no-man's-land without any major resistance backing you up, or you got impatient and entered before the next candle actually closed below the hammer to confirm the reversal.


