

When the Market Goes Parabolic
Between late 2017 and early January 2018, XRP surged from under $0.20 to approximately $3.84 — a gain of over 19x in less than two months. Crypto forums were full of predictions that XRP would hit $10. New buyers piled in at the top.
Then the price fell more than 90% over the course of 2018.
That is what an ATH moment tends to look like in practice: a record-breaking price, peak optimism, and risk that gets collectively ignored by the people who need to pay attention to it most. Understanding what ATH actually means — and how to respond to it — is one of the more useful habits a crypto trader can build.
What Is ATH in Crypto?
ATH stands for All-Time High. In crypto, it refers to the highest price a digital asset has ever traded at since it was first listed on an exchange — from its very first trade up to the present moment.
The concept is not unique to crypto. Stock market participants use "all time high" in exactly the same way when discussing index levels or individual share prices. The logic is identical: the highest price ever recorded, at any point in the asset's history.
A few mechanics worth understanding:
ATH is measured intraday, not at the close. Because crypto markets run 24 hours a day, seven days a week, the all-time high captures the highest price reached at any moment — not the daily closing price. An asset can spike to a new ATH during a volatile hour and pull back significantly before the next morning.
ATH updates in real time. Every time a new peak is set, the previous ATH is replaced. There is no expiry. A high set five years ago remains the ATH until it is surpassed.
Price data can vary by platform. Different exchanges report slightly different ATH figures depending on their trading pairs, liquidity, and the exact moment they recorded a peak. XRP's all-time high is listed as $3.84 on Coinbase and $3.65 on CoinMarketCap — both figures reference the same January 2018 peak, captured at different moments across different order books. Neither figure is wrong; they reflect the fragmented nature of crypto market data.
When used without further context, ATH almost always refers to price. It can technically apply to market capitalization or trading volume as well, but in everyday usage, price is the default meaning.
ATH and ATL: Two Reference Points, Not Two Predictions

ATH has a direct counterpart: ATL (All-Time Low), the lowest price a cryptocurrency has ever reached since it began trading. Together, they define the outer boundaries of an asset's complete price history.
|
ATH (All-Time High) |
ATL (All-Time Low) |
|
|
Definition |
Highest price ever recorded |
Lowest price ever recorded |
|
Market sentiment |
Optimistic, FOMO risk elevated |
Pessimistic, panic-selling risk elevated |
|
Common behavior |
Late buyers chasing momentum |
Existing holders capitulating |
|
Practical use |
Identifies where historical resistance is absent |
Marks historical downside extremes |
Neither extreme tells you what will happen next. ATH does not mean the price will keep rising, and ATL does not mean the price cannot fall further. They are historical data points that help frame context — not signals to act on in isolation.
One practical use that traders do find valuable: measuring how far a current price sits from an asset's ATH. A coin trading 80% below its all time high might look cheap, but whether it represents value depends on why it fell and whether the fundamentals have changed — not just on the distance from the peak.
Understanding All-Time High Through XRP's Price History
XRP offers one of the most instructive all-time high case studies in crypto — not because it followed a clean trajectory, but because it did not. The full arc of the XRP ATH story covers regulatory shocks, legal battles, partial recoveries, and a 2025 rally that came close to but did not definitively break the seven-year-old record. Each phase teaches something different about how ATH levels actually function in a live market.
January 2018: The First ATH and What Followed
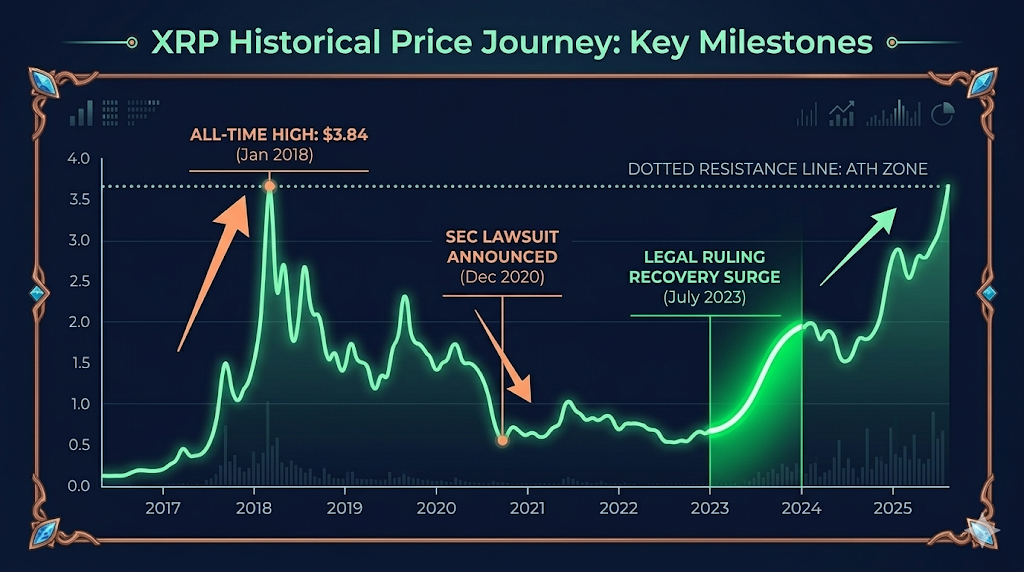
XRP hit approximately $3.84 on January 4, 2018 — its first and still-standing all-time high. CoinMarketCap records a slightly different peak of $3.65 on January 5, 2018, reflecting differences in exchange coverage at the moment of measurement. The move was driven by a combination of factors: a broad crypto bull market, significant retail enthusiasm, Ripple's announcements of partnerships with financial institutions, and heavy media coverage that pulled in first-time buyers.
What made this ATH dangerous for late entrants was not the price itself, but the context. By the time XRP was trading above $3, most of the structural move had already occurred. Buyers who entered in December 2017 or early January 2018 — drawn in by the headlines and the price chart — were buying into a market where early holders had substantial incentive to sell. Within weeks of the ATH, the price had already begun its reversal. By the end of 2018, XRP had lost more than 90% from peak.
Late 2020: When Fundamentals Move the ATH Baseline
In November 2020, the U.S. Securities and Exchange Commission filed a lawsuit against Ripple Labs, alleging that XRP had been sold as an unregistered security. The impact was immediate: the price dropped from approximately $0.70 to around $0.20, and several major U.S. exchanges suspended XRP trading.
This episode illustrates an important point about ATH levels that technical analysis alone cannot capture. The all-time high did not change, but the fundamental risk profile of the asset changed dramatically. Traders who were watching only price in relation to the 2018 ATH had an incomplete picture of what they were holding.
July 2023: A Legal Catalyst Closes the Gap
A U.S. federal court ruled that XRP sold on secondary market exchanges did not constitute an unregistered securities offering — a landmark decision that reshaped how the market priced regulatory risk into the asset. XRP surged approximately 72% in a single day, one of the sharpest single-day moves for a major asset in recent memory. The lesson here is that proximity to an ATH can be driven by the removal of risk, not only by the addition of new buyers.
2025: Approaching the Record Without Breaking It
In January 2025, XRP reached approximately $2.76, its highest level in seven years, before pulling back as broader market momentum softened. By July 2025, XRP peaked at around $3.66 — a figure that approached but did not convincingly surpass the January 2018 record across all major exchanges. XRP currently trades well below its historical peak — you can check the live XRP price on Tapbit for the most up-to-date figure before making any trading decisions.
The XRP ATH narrative is ongoing. But the consistent pattern across its history is clear: reaching the vicinity of an all-time high does not guarantee a breakthrough, and a breakthrough does not guarantee continuation. Each attempt has been shaped by a specific combination of macro conditions, regulatory developments, and market structure — not simply by the existence of the prior ATH.
Why ATH Is When Market Psychology Works Against You
The all-time high is not just a price level — it arrives with a psychological environment that systematically pushes traders toward worse decisions. Understanding the mechanics helps you resist them.
Price discovery removes the historical map
Once price breaks above a previous all-time high, there is no prior trading activity to reference above that level. Traders call this "price discovery" — a zone where the normal anchors of support and resistance no longer exist. Without historical reference points, price can move much further and much faster in both directions than traders expect. Volatility tends to increase, not decrease, above an ATH.
FOMO compounds at exactly the wrong moment
New all-time highs generate media coverage. Media coverage attracts participants who were not previously following the asset. Many of those participants buy based on momentum and fear of missing out rather than any analysis of value. This additional demand can extend a move beyond what fundamentals support — and reverse just as quickly when sentiment shifts.
Profit-taking pressure builds in parallel
While new buyers are entering, traders who accumulated at much lower prices are looking for rational exit points. An ATH is a psychologically obvious place to take profit. This creates simultaneous buying and selling pressure that can produce sharp, sudden reversals even within a broader uptrend.
Contagion effects run both ways
When major assets like Bitcoin reach new all-time highs, capital tends to rotate outward into altcoins, including XRP. The same rotation can reverse quickly. Traders who enter XRP during a Bitcoin-driven ATH rally may find themselves exposed to a drawdown that has as much to do with Bitcoin's correction as with anything XRP-specific.
A Framework for Trading Around ATH Levels
ATH conditions call for more discipline, not faster execution. Three practical approaches that experienced traders use:
Watch how the breakout develops before acting
A genuine breakout above an all-time high typically moves through distinct phases: an initial surge through the resistance level on above-average volume, a pullback that tests whether the old ATH can now hold as support, and then either a resumption of the uptrend or a failure that sends price back below the breakout level.
Entering on the initial surge — the moment that generates the most excitement — tends to offer the worst risk-to-reward ratio. Waiting for the pullback and confirmation gives you a clearer stop level and a more defensible entry price.
Use Fibonacci extensions to identify upside targets
Above an ATH, there is no historical resistance. Fibonacci extensions — derived from a prior significant swing low to the ATH breakout point — give traders a structured way to identify potential areas of profit-taking before the price gets there. Commonly used extension levels are 1.272, 1.618, 2.0, and 2.618. These are not price predictions; they are planning anchors for scaling out of a position in stages rather than trying to pick a single exit point.
Define your position management plan before the trade opens
|
Approach |
When it makes sense |
Non-negotiable condition |
|
Hold the full position |
Strong fundamental conviction, long time horizon |
Maximum acceptable drawdown defined in advance |
|
Scale out in stages |
Locking in partial gains while keeping upside exposure |
Exit prices set before entry, not adjusted mid-trade |
|
Full exit |
Multiple indicators signaling momentum exhaustion |
Decision based on pre-defined criteria, not panic |
In all three cases, the stop-loss level must be determined before the position is opened — not after the trade starts moving against you. Near an ATH, the absence of historical support below means a reversal can accelerate faster than you expect.
Three Persistent Misconceptions About All-Time Highs
"If it reached this level before, it will get back there."
Past price levels are not commitments. The XRP all-time high from 2018 took more than seven years to approach again — and the approach itself was not a clean reclaim. Many assets never return to a prior ATH. Historical peaks are data points, not destinations.
"Trading below ATH means it is safer to buy."
An asset can drop 80% from its all-time high and then drop another 80%. Distance from a peak says nothing about current valuation. Low price relative to ATH needs to be weighed against why the price fell, whether the underlying fundamentals have changed, and what the current market structure looks like.
"Reaching ATH means it is time to sell."
Some of the strongest sustained moves in crypto history began the moment an asset broke above its previous all-time high and entered price discovery for the first time. A mechanical sell-at-ATH rule would have terminated many of the most profitable long positions in the asset class. ATH should trigger heightened attention and a review of your plan — not an automatic exit.
How to Trade XRP Futures on Tapbit (where available in your region)
If you have a view on XRP's direction around a key level — approaching a potential new all-time high or pulling back from one — futures trading lets you act on that view in either direction. Here is how to trade the XRP-USDT perpetual contract on Tapbit in four steps.
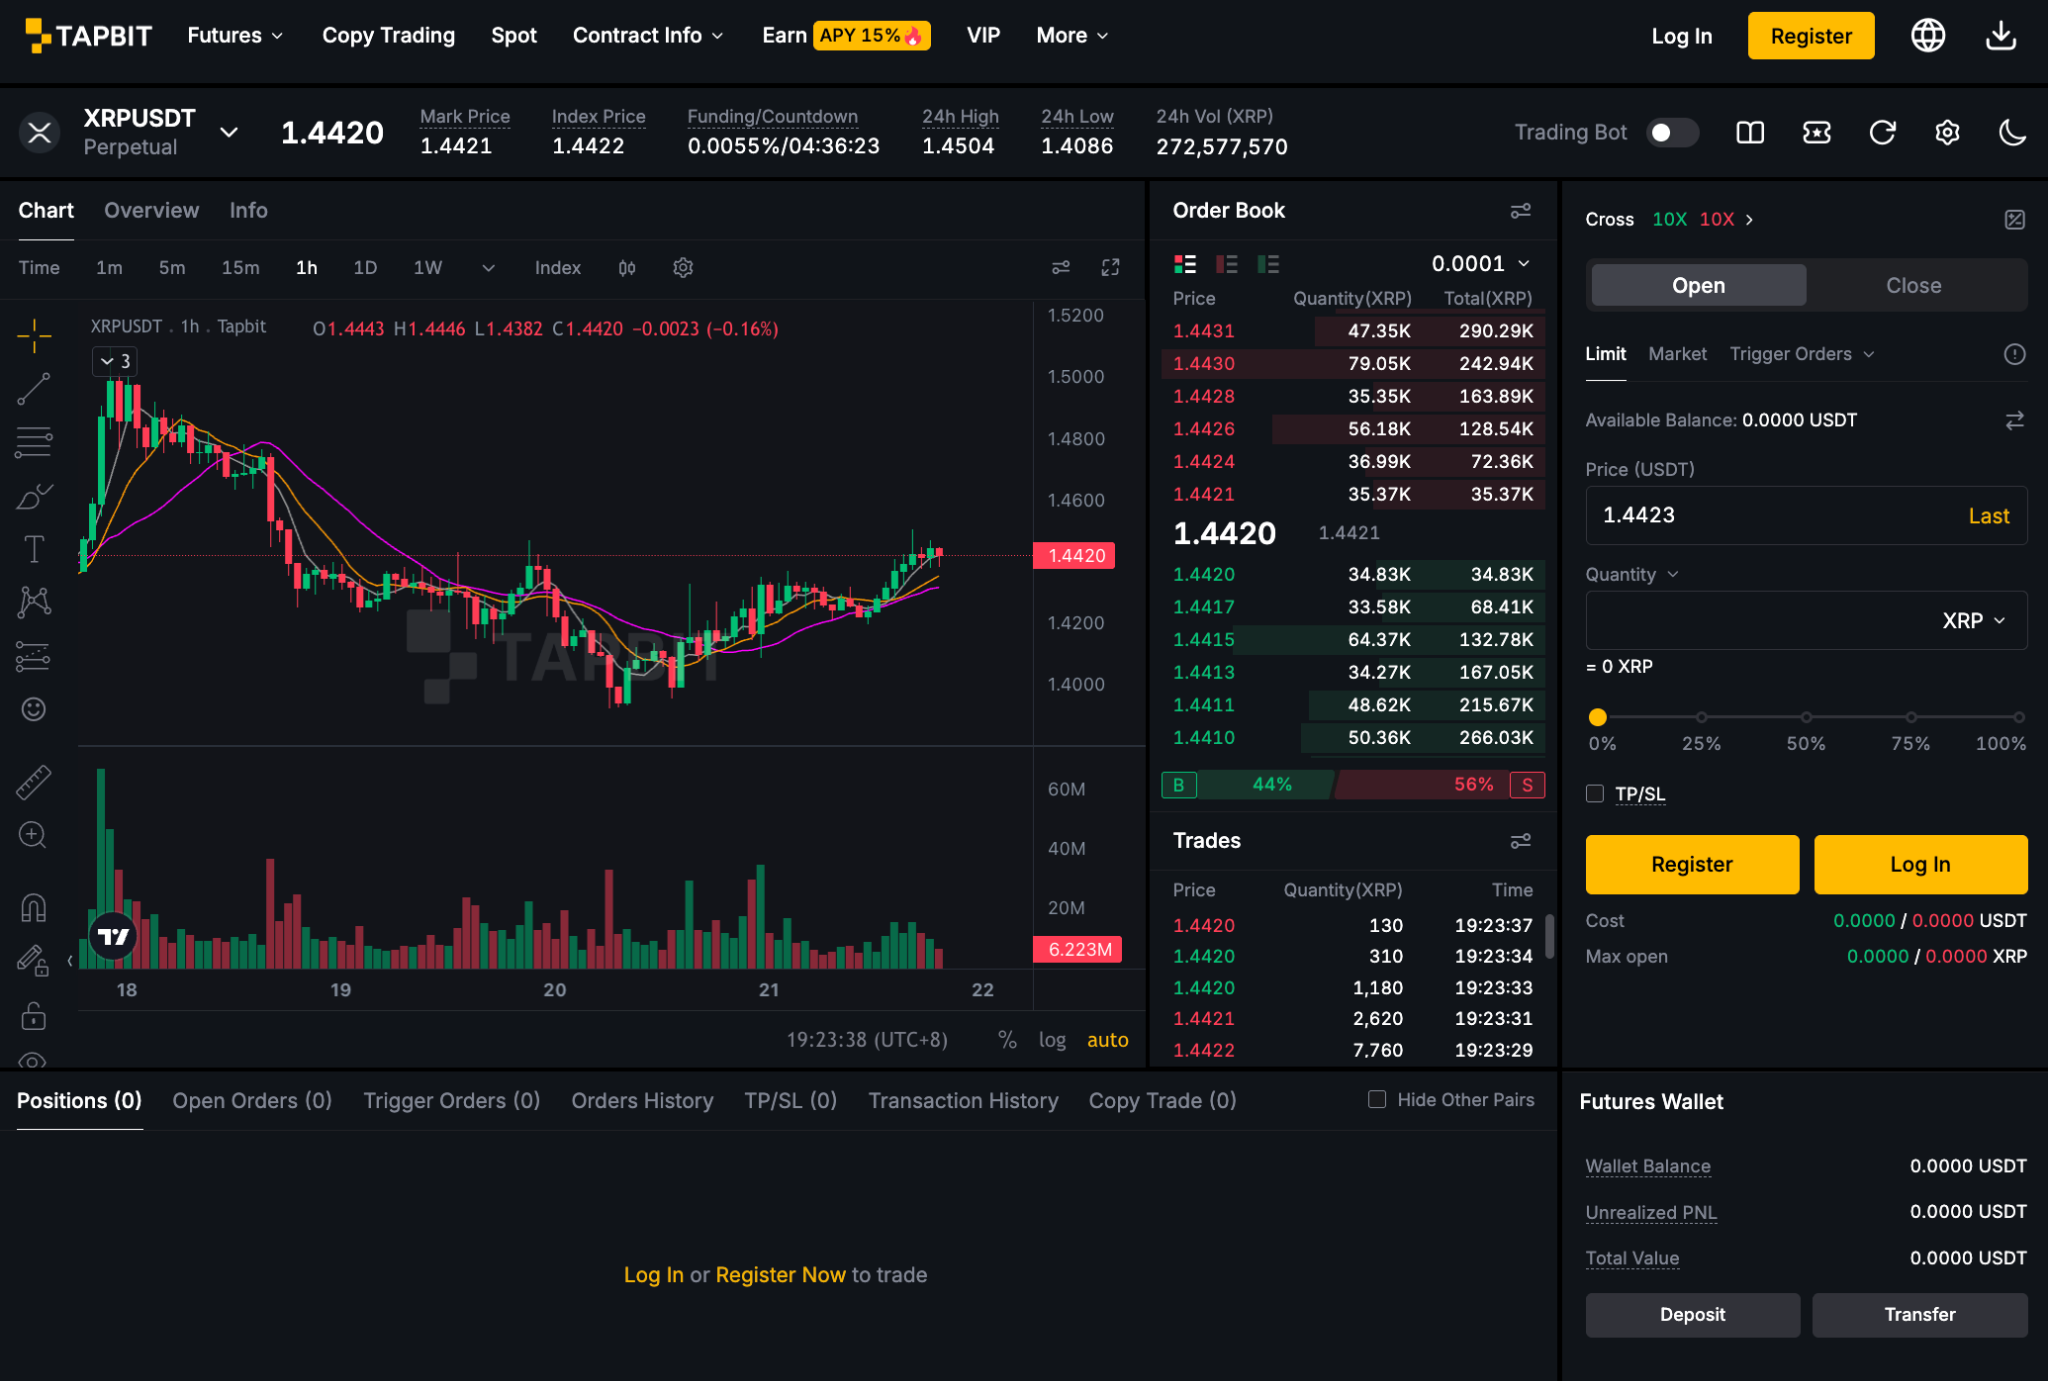
Step 1: Register and fund your account
Create a Tapbit account, complete identity verification, and transfer USDT from your spot wallet into your futures account. XRP-USDT perpetual contracts use USDT as both margin and settlement currency.
Step 2: Open the XRP futures page and configure your parameters
Go to Futures in the navigation bar and select XRP-USDT Perpetual. Before placing any order, set two things:
-
Leverage: Choose a multiplier that fits your risk tolerance. During periods of elevated volatility — which are common near all-time high levels — lower leverage (3–5x) limits your exposure to sharp reversals.
-
Margin mode: Isolated margin limits your maximum loss on a given trade to the margin allocated to that position. Cross margin draws from your full available USDT balance, which provides more buffer against short-term fluctuations but increases overall account risk.
Step 3: Place your order and attach take-profit / stop-loss levels
Choose your order type: a limit order lets you target a specific entry price; a market order fills immediately at the current price. Set your position size and choose your direction — Buy / Long if you expect price to rise, Sell / Short if you expect it to fall. Set your take-profit and stop-loss at the same time. ATH conditions can produce sudden reversals; your exit plan should be in place before the position is open.
Step 4: Monitor your position and follow your plan
Track your position from the Positions tab, where you can see unrealized PnL, margin utilization, and liquidation price in real time. If the market moves against your analysis, execute your pre-defined stop. Adjusting your stop-loss downward mid-trade to avoid realizing a loss is one of the most reliably costly habits in futures trading.
Risk disclosure: Futures trading involves leverage. Losses can exceed your initial margin if price moves against your position. Only trade with capital you can afford to lose. Understand how margin, leverage, and liquidation work before opening a position.
Tapbit's fee structure is publicly disclosed. New users can also check available welcome rewards after registering.
Summary
ATH — all-time high — marks the highest price a cryptocurrency has ever reached, and it tends to arrive with peak optimism, peak media attention, and peak FOMO. None of those things make it a buy signal or a sell signal on their own.
XRP's price history makes the point concretely. Its all-time high was set in January 2018, approached again in 2025, and still functions as an active reference point for traders watching the asset. The gap between the current price and the XRP ATH tells you something about where the market has been. It tells you very little about where it is going.
What matters more than the ATH itself is the quality of your response to it: a structured entry process, a profit-taking plan set before the position opens, and a stop-loss level that does not move just because the trade is uncomfortable.
If you want to follow XRP's price in real time, check the live XRP price on Tapbit. When you are ready to act on your analysis, create an account to access spot and futures trading.
Frequently Asked Questions
What does ATH mean in crypto?
ATH stands for All-Time High. In crypto, it refers to the highest price a digital asset has ever traded at since it was first listed on an exchange. The term applies to any asset — stocks, indices, and commodities use the same concept — and in crypto it almost always refers to price rather than market cap or volume unless otherwise specified.
What is XRP's all-time high price?
XRP's all-time high is approximately $3.84, recorded on January 4, 2018, according to Coinbase data. CoinMarketCap records a slightly different figure of $3.65 on January 5, 2018, due to differences in exchange coverage and the exact moment of measurement. In July 2025, XRP came close to this level again, reaching approximately $3.66 — but whether this officially surpassed the 2018 record depends on which platform's data you reference.
What is the difference between ATH and ATL?
ATH (All-Time High) is the highest price ever recorded for an asset. ATL (All-Time Low) is the lowest. Together they define the full outer range of an asset's price history. ATH tends to coincide with peak market optimism and elevated FOMO risk, while ATL tends to coincide with peak pessimism and panic-selling behavior. Neither level is a reliable buy or sell signal on its own.
Is it a good idea to buy crypto at an all-time high?
Not automatically, and not without a plan. Buying near an all-time high means entering at a price point where there is no historical resistance above, which increases uncertainty. It also means entering when sentiment is typically most bullish — the condition least favorable for finding undervalued assets. That said, some of the strongest sustained trends in crypto have begun precisely when an asset broke above its previous ATH. The question is less about whether the price is at ATH and more about whether you have a clear entry rationale, a stop-loss level, and a profit-taking plan defined before you open the position.
Does ATH guarantee a price will keep rising?
No. ATH is a historical record, not a directional signal. Many assets have reached an all-time high and subsequently declined by 50%, 80%, or more without ever reclaiming that level. XRP itself spent more than seven years below its 2018 ATH. Breaking above a previous all-time high removes historical resistance and can enable further upside, but it does not make further upside inevitable. Risk management remains essential regardless of whether an asset is at, near, or far below its ATH.


