Morgan Stanley: Gold finds strong support at $4,000; further rise in yields is not necessarily bearish for gold
 Tapbit Wire
Key Points
· Gold is outperforming its macro backdrop: the relationship between gold and real yields from March to July would have implied a gold price below $3,000/oz, roughly 28% below current levels.
· From here, any pullback in real yields should be positive for gold, lowering the cost of carry and encouraging investment inflows.
· But higher yields do not necessarily mean a lower gold price — if the rise reflects concerns about fiscal sustainability and sovereign risk, it will support gold.
· Lower oil prices should support gold, but if further oil strength raises growth and stagflation concerns, gold is equally likely to stay firm.
1. Gold has outperformed its macro backdrop
Despite the Fed's recent rate hikes, a stronger dollar, and elevated global long-term bond yields, gold has fallen only 10% from its August high and remains above $4,000/oz.
By contrast, if the relationship between gold and real yields observed from March to July had held, the gold price would already have fallen below $3,000/oz, 28% below current levels.
[Figure 1: Gold is increasingly resisting macro headwinds: strong central bank and ETF demand are helping offset the impact of rising real yields, indicating that gold's traditional relationship with interest rates is changing once again]
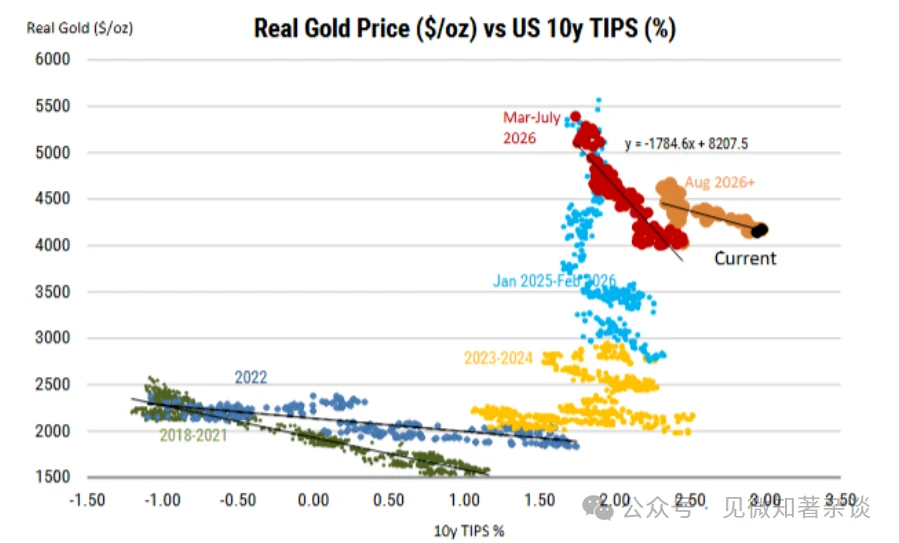
Lower yields provide the clearest upside path, but higher yields are not necessarily bearish: any weakening in yields would lower the cost of holding gold, while our economists also expect the Fed to hike fewer times than the market is pricing.
However, if yields rise further on fiscal sustainability concerns, investors may increasingly rotate into physical assets with no credit risk, which could likewise keep gold firm.
MS outlook: Gold remains our top commodity pick — we target $5,000/oz by Q2 2027.
Strong physical demand has established support around $4,000/oz, with upside if macro conditions ease or oil prices pull back. Fiscal sustainability and/or stagflation concerns provide alternative upside catalysts.
Key risks include further Fed tightening, a stronger dollar, central bank selling, and technical unwinding.
2. Gold's relationship with real yields is changing again
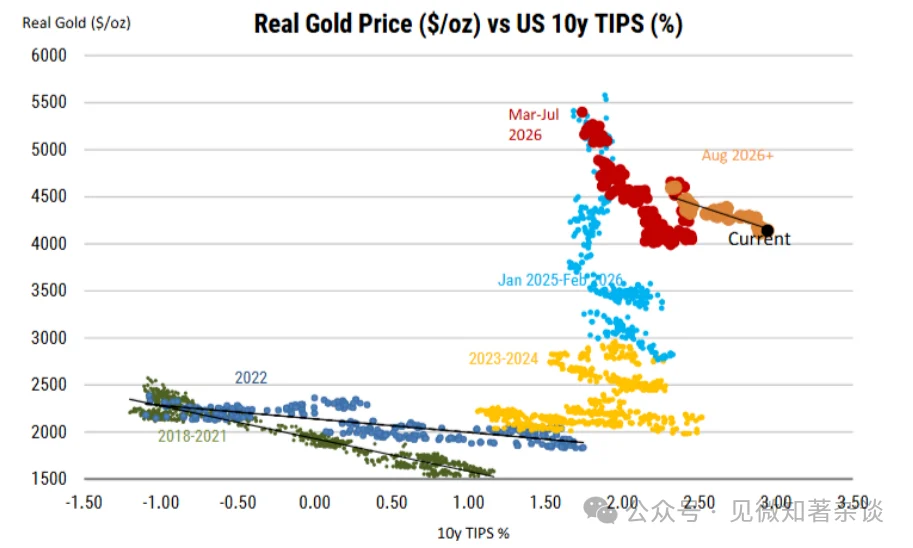
Gold's relationship with real yields has been evolving since 2022: Chart 2 shows how the relationship has changed since the outbreak of the Russia-Ukraine conflict.
During this period, gold performed far better than expected overall, as central banks roughly doubled annual purchases from about 500 tonnes/year to about 1,000 tonnes/year; subsequently in 2025, the price rally accelerated as ETFs added the most gold outside of 2020 and 2008.
However, after the outbreak of the Middle East conflict, gold reverted to a more "normal" relationship with yields — the gold price fell as rate-hike expectations rose, while some central banks sold gold to ease currency pressures.
[Figure 2: Given where real yields are, gold has performed far better than expected]
Gold's macro conditions have deteriorated further: in August, macro conditions briefly improved as market expectations for Fed rate hikes temporarily eased, but they deteriorated again heading into September.
The Fed hiked rates for the first time since 2023, the dollar strengthened, and the US 10-year Treasury yield rose to its highest level since the early 2000s.
The rise in nominal yields was driven almost entirely by real yields, with the 10-year breakeven inflation rate rising only 4bp.
Higher real yields raise the opportunity cost of holding non-yielding gold, while relatively stable inflation expectations limit gold's appeal as an inflation hedge.
Both of these would normally point to significant downside risk for gold.
[Figure 3: In early October, the US 10-year yield rose to its highest level since 2002]
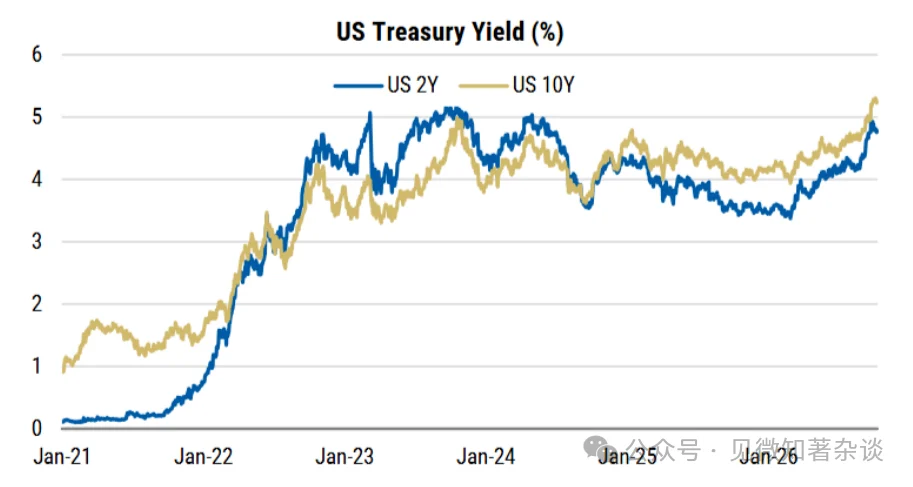
But gold's relationship with real yields is evolving again: the gold price has indeed pulled back, and is now 10% below its August high.
However, against this macro backdrop, gold's decline should have been far larger. Extrapolating the relationship between gold and the 10-year real yield observed from March to July implies the gold price should now be below $3,000/oz, 28% below current levels.
Instead, the slope of this relationship line has flattened, keeping the gold price firm even with real yields at more than 20-year highs.
We believe this divergence reflects increasingly important structural sources of demand, particularly central bank buying and ETF inflows, which have continued even after the September rate hike.
3. Physical demand is reducing gold's sensitivity to macro factors
Central bank buying momentum continues: after a weak Q1, central banks bought 289 tonnes of gold in Q2 2026, an annualized 1,155 tonnes, versus 860 tonnes in FY2025, and our model forecasts 800 tonnes for 2026.
Early signs suggest Q3 momentum remains strong, which could pose upside risk to our 2026 forecast.
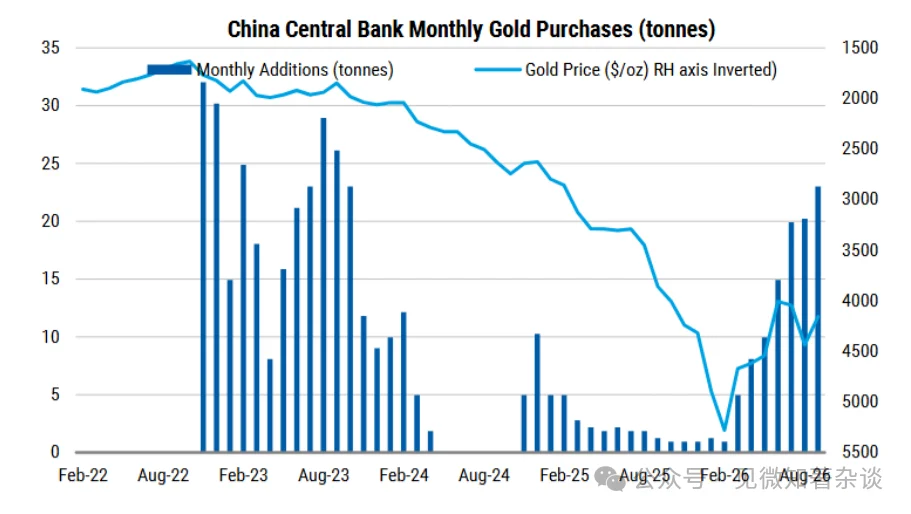
For example, the PBoC has bought 103 tonnes this year, the most since 2023, with 60% concentrated in Q3.
[Figure 4: The PBoC has added 103 tonnes of gold this year, the most since 2023]
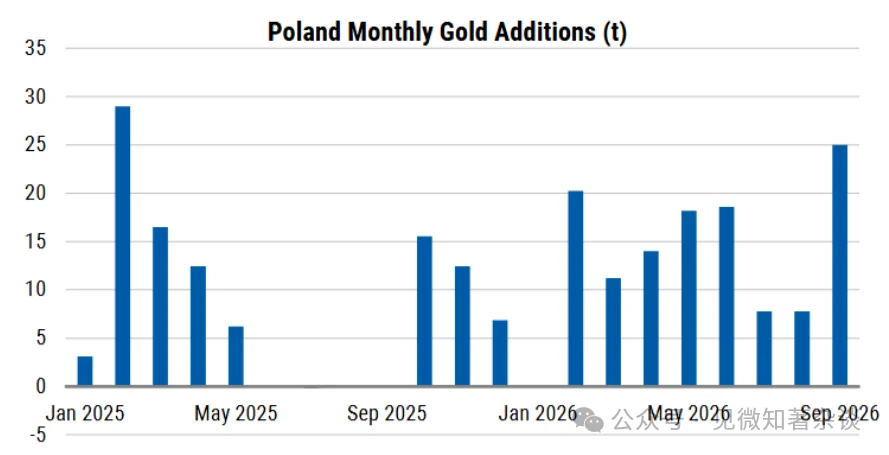
Poland remains on track to be the largest buyer again in 2026, with its gold reserves having risen to 673 tonnes.
This means 123 tonnes have been bought this year, exceeding the 102 tonnes added in 2025.
September was particularly strong. In addition, the Democratic Republic of the Congo announced plans to raise its gold reserves from 3 tonnes to 5 tonnes by year-end, and Serbia has also recently added to its gold holdings.
[Figure 5: Poland has added 123 tonnes of gold this year, exceeding its record additions in 2025]
Broader Chinese demand also appears strong: as of August, China's gold imports reached 1,100 tonnes, an annualized pace that would be the highest since 2017.
This scale is more than 10 times the central bank's additions, indicating that demand elsewhere in China is also robust, with weak property and equity markets prompting investors to rotate into alternative assets such as gold.
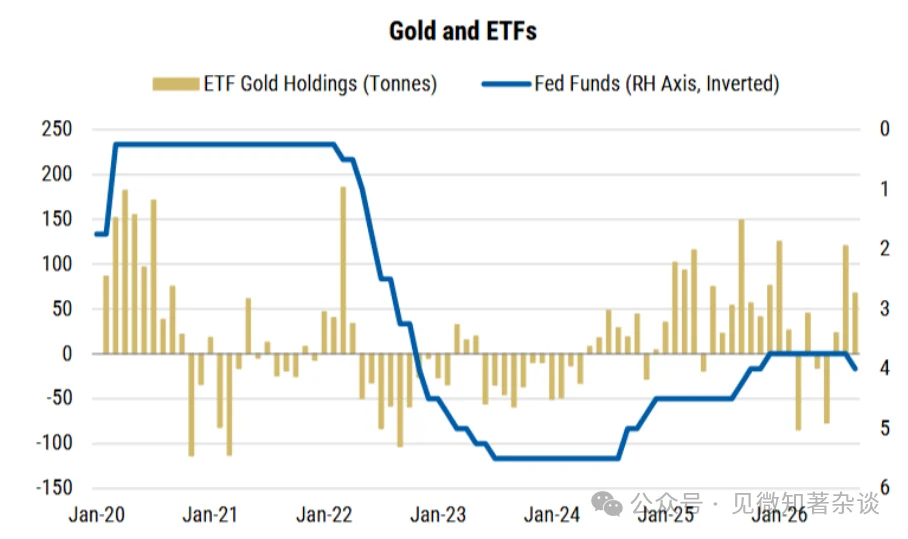
ETFs are still adding despite rate hikes: a major driver of gold's strength in 2025 was the 800 tonnes of ETF inflows that arrived when the Fed began cutting rates.
Inflows this year have been slower, at just 250 tonnes, which is understandable given the more challenging macro backdrop.
However, recent ETF inflow data looks more encouraging — global gold ETFs recorded their strongest quarterly inflow on record in dollar terms in Q3, at $31 billion, accounting for roughly 220 tonnes of the ~250 tonnes added this year, despite the Fed hiking rates during the period.
In addition, European inflows exceeded US inflows for the first time since 2021, led mainly by the UK.
[Figure 6: ETFs remain net buyers even as the Fed hikes rates]
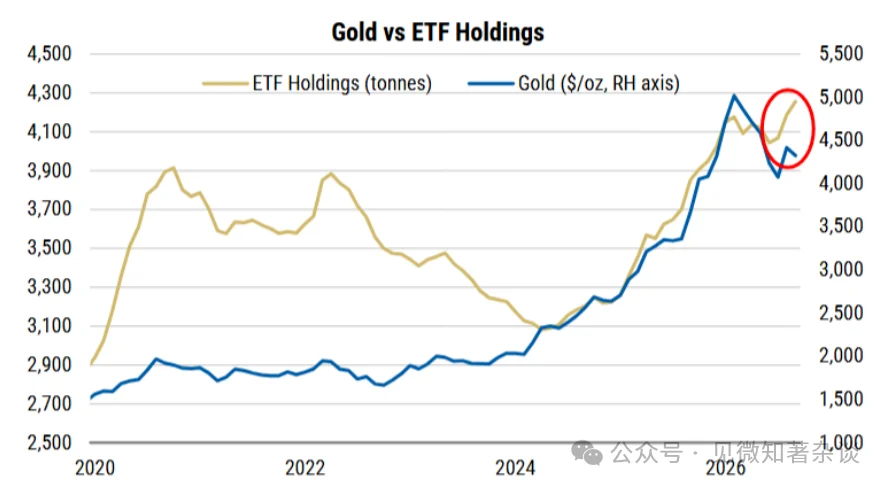
[Figure 7: After tracking closely since mid-2024, ETF holdings have also diverged from the gold price]
Fiscal concerns are changing the relationship between gold and yields: rising bond yields usually weigh on gold, but the reason for the rise matters.
After the Fed's September rate hike, yields initially fell, then long-term yields rose again, steepening the US Treasury yield curve.
The US fiscal deficit is approaching $2 trillion, and growing bond issuance as well as competition from long-term AI-related corporate borrowing are adding pressure, possibly reflecting market demand for higher compensation for duration and fiscal risk.
As the World Gold Council has noted, this may reflect "concerns about inflation uncertainty, fiscal sustainability, and sovereign bond market risk."
Such concerns may encourage diversification into gold — which has no issuer or credit risk — helping explain why ETF demand has remained firm even as yields rise.
4. Any pullback in rate-hike expectations or bond yields could bring upside
Easing rate-hike expectations could be a catalyst for gold to rally: lower interest rates and/or bond yields reduce the opportunity cost of holding gold and may encourage new ETF inflows and speculative buying.
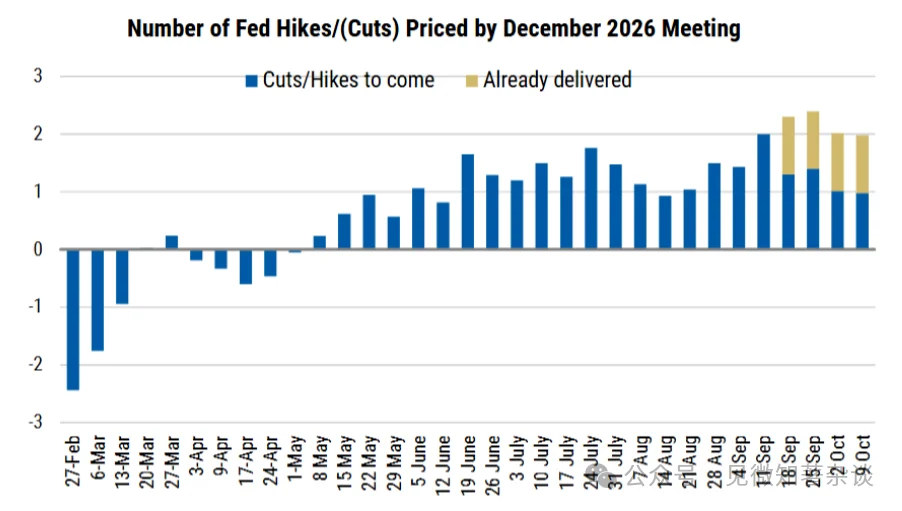
Our economists expect the Fed to hike only two more times by end-2027, versus roughly 3.5 hikes priced by the market.
If inflationary pressures ease, causing the Fed to hike fewer times than expected, this could ease rate-hike expectations and support gold.
The team also expects the US 10-year yield to fall from the current 5.23% to 4.7% by Q3 2027.
Treasury intervention provides another potential catalyst, though further intervention may be unlikely: in August, the Treasury's buybacks of long-term securities coincided with a temporary stabilization in yields and a sharp rebound in gold, with positioning and technical factors amplifying the move.
Further bond purchases or other measures to ease pressure on long-term yields could again provide support, although recent comments from Treasury Secretary Scott Bessent suggest limited appetite for further active intervention.
As such, the November 4 refunding announcement will be an important event to watch.
Separately, even if long-term yields remain high on fiscal concerns, a steeper yield curve could reinforce gold's appeal as a substitute for sovereign debt, as long as short-term yields fall on declining rate-hike expectations.
5. Further rises in yields are not necessarily bearish for gold
[Figure 8: ETF holdings and interest rates]
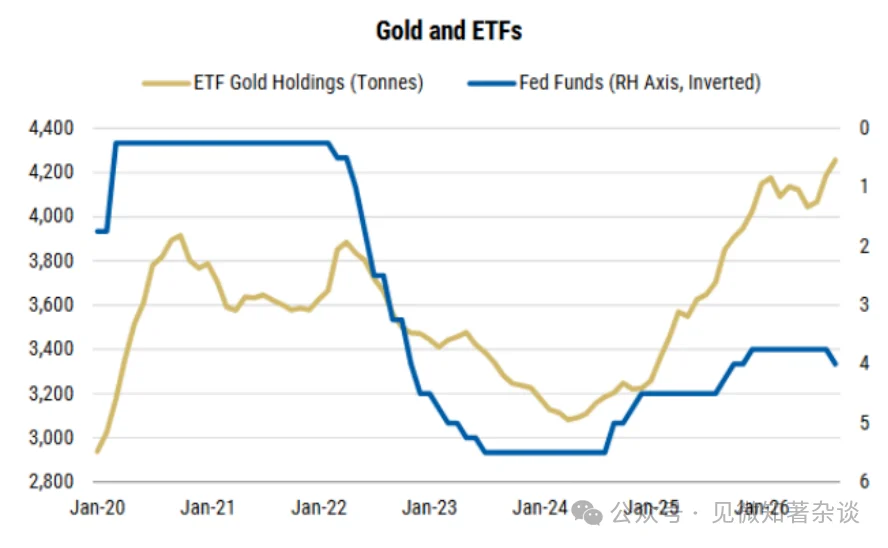
As noted above, higher bond yields usually weigh on gold by raising the opportunity cost of holding a non-yielding asset.
However, if a further rise in long-term yields reflects growing concerns about fiscal sustainability and sovereign debt risk, rather than monetary policy tightening, this traditional negative correlation may be weakened.
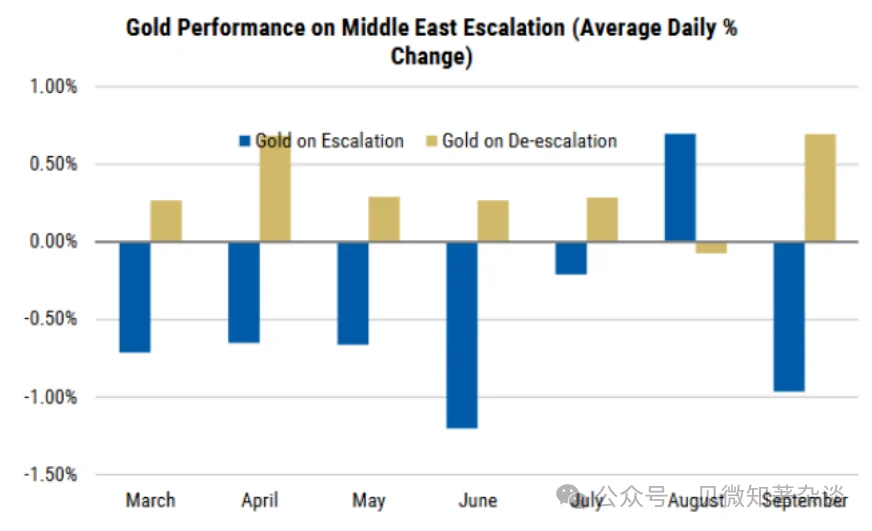
[Figure 9: Since the outbreak of the Middle East conflict, gold has risen an average of 0.2% on days when oil prices fell, and fallen an average of 0.5% on days when oil prices rose]
Gold has no issuer or credit risk, which may encourage diversification out of government bonds, thereby offsetting the headwind from higher real yields.
Historically, gold has also been able to rise alongside rising bond yields during periods of high inflation and fiscal uncertainty (including several periods in the early 1980s).
This may already be happening, with ETF inflows remaining strong even as yields rise.
The Bundesbank president recently made a similar argument: "The recent rise in global government bond yields has once again increased the relative attractiveness of debt securities.
At the same time, rising debt levels have heightened concerns about the credit risk of these assets.
In addition, geopolitical risks are likely to continue to influence reserve management decisions. Taken together, the case for further diversification into gold remains strong." Germany holds the world's second-largest gold reserves.
6. Middle East conflict: scenario analysis for gold
Gold has not yet played its traditional safe-haven role in this conflict: we examined whether gold retains its status as a safe-haven asset against the backdrop of its price decline after the conflict broke out.
The key conclusion is that while gold performs well in demand shocks, it struggles in supply shocks, especially when inflation expectations and bond yields rise as a result.
It performs best on days when oil prices fall: since the conflict broke out, gold's short-term performance has been closely tied to oil prices and Treasury yields, with the strongest returns typically coming on days when oil prices fall.
Lower oil prices ease inflation concerns, reduce expectations of further Fed tightening, and allow yields to fall, thereby pushing gold higher.
If we see a de-escalation in the Middle East that brings oil prices down and eases the inflationary pressures that previously drove Fed tightening, gold should be supported, especially if Fed rate-hike expectations ease and the dollar weakens.
But further oil strength could begin to weigh on growth and raise stagflation concerns: so far, gold has come under pressure when oil prices rise, especially since late August, with Brent crude rising from $90/bbl to the current $105/bbl, while gold fell from $4,650/oz to $4,160/oz.
In the near term, an oil price spike could put further downward pressure on gold, particularly if gold is used as a source of liquidity.
However, we believe pullbacks should be bought, especially if oil prices remain elevated for an extended period. A sustained period of high oil prices would raise stagflation risk — energy costs feed through to broader inflation, while squeezing household incomes, corporate profits, and growth.
As growth weakens, central banks may find it increasingly difficult to justify further tightening, and pausing rate hikes while inflation remains elevated should, all else equal, support gold.
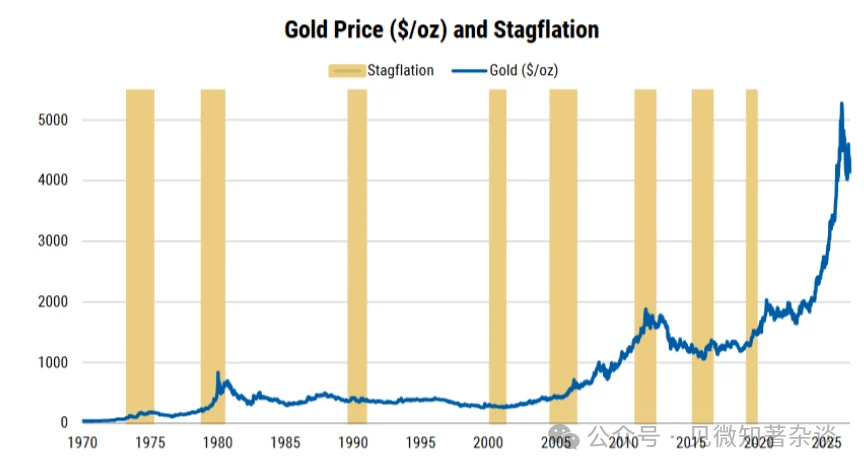
Stagflation environments also tend to weigh on both equities and bonds, reinforcing gold's role as a portfolio diversifier. Historically, this has tended to correlate with strong gold performance.
[Figure 10: The market expects one more hike by year-end and another 2.4 hikes in 2027]
[Figure 11: Gold tends to perform well in stagflation environments]
7. Positioning and technical levels matter for the timing and magnitude of moves
CTAs and systematic investors contributed significantly to gold's price volatility in 2026.
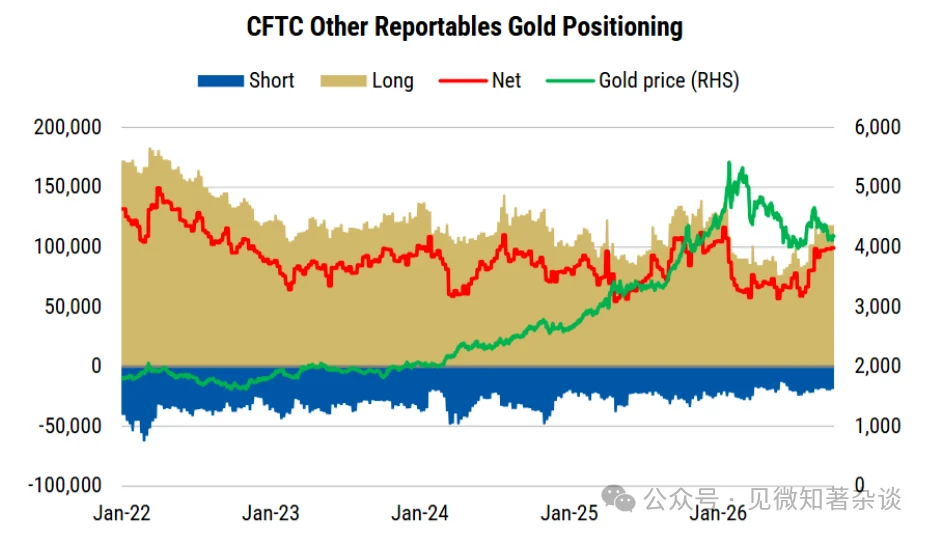
CFTC positioning data shows that net longs peaked in January, then remained near three-year lows through Q2 and early Q3. Since then we have seen some recovery, concentrated mainly in August, but the more interesting development is the divergence between managed money and other reportable positions.
The World Gold Council links other reportable positions to CTAs, which can suddenly reverse direction and amplify moves in both directions.
Managed money net longs bottomed in May when gold hit $4,000/oz, but other reportable positions did not begin to rise until late July.
This coincided with gold's rapid breakout above $4,600/oz, showing how price moves can be amplified.
Net positioning in other reportable positions remained broadly stable in September and early October, and with shorts already near historic lows, any meaningful recovery would require new CTA buying rather than short covering.
[Figure 12: CFTC data shows other reportable positions have been adding longs since late July, though the pace of additions slowed in September]
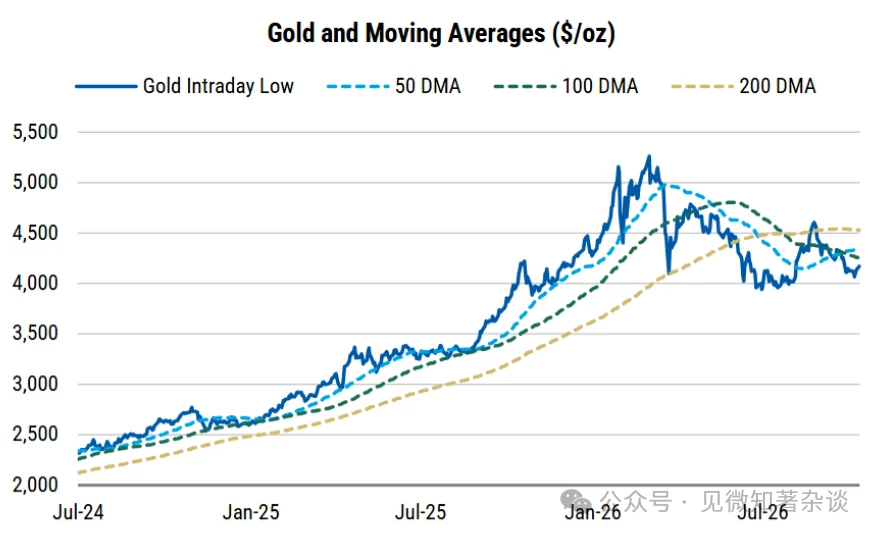
Technical levels also matter: gold is currently trading below key technical levels, having failed to meaningfully break above the 200-day moving average in August. The spread between these technical levels has also narrowed significantly since March, with the gap between the lowest and highest moving averages at only about $270/oz.
The moving averages have also crossed multiple times, with the 50-day and 100-day averages currently about $80/oz apart. If trend signals across different timeframes begin to realign, this compression could presage a decisive directional move.
Since many CTA models are built around these signals, a recovery toward the 200-day moving average could bring a new round of upside trend, while a break below the year's low could bring a new round of selling.
With this week's US CPI release, the October 28 Fed decision, and the November 4 refunding announcement approaching, systematic flows are likely to amplify gold's next move.
[Figure 13: Gold is trading below key technical levels]
8. Gold outlook: strong resilience
Gold has shown resilience in the face of an increasingly challenging macro backdrop, thanks to strong central bank demand and ETF inflows.
Central bank buying appears to have accelerated in Q3, posing upside risk to our full-year 800-tonne forecast, while most of the roughly 250 tonnes of ETF additions this year occurred in Q3, despite the Fed implementing its first rate hike since 2023 during the period.
We believe this reflects gold's growing appeal as a hedge against geopolitical risk and government concerns about debt sustainability.
With gold repeatedly finding support around $4,000/oz, we view the current risk-reward as attractive, with a target price of $5,000/oz by Q2 2027.
Lower yields provide the clearest upside path.
Falling bond yields and/or oil prices could ease Fed tightening expectations, lower the cost of holding gold, and encourage new investment inflows.
However, if a further rise in long-term yields is driven by fiscal sustainability concerns, it is not necessarily bearish — this would encourage diversification into physical assets with no credit risk, such as gold.
Similarly, while rising oil prices may initially weigh on gold through higher rate expectations, sustained strength could ultimately shift market focus toward growth and stagflation, creating another source of support.