
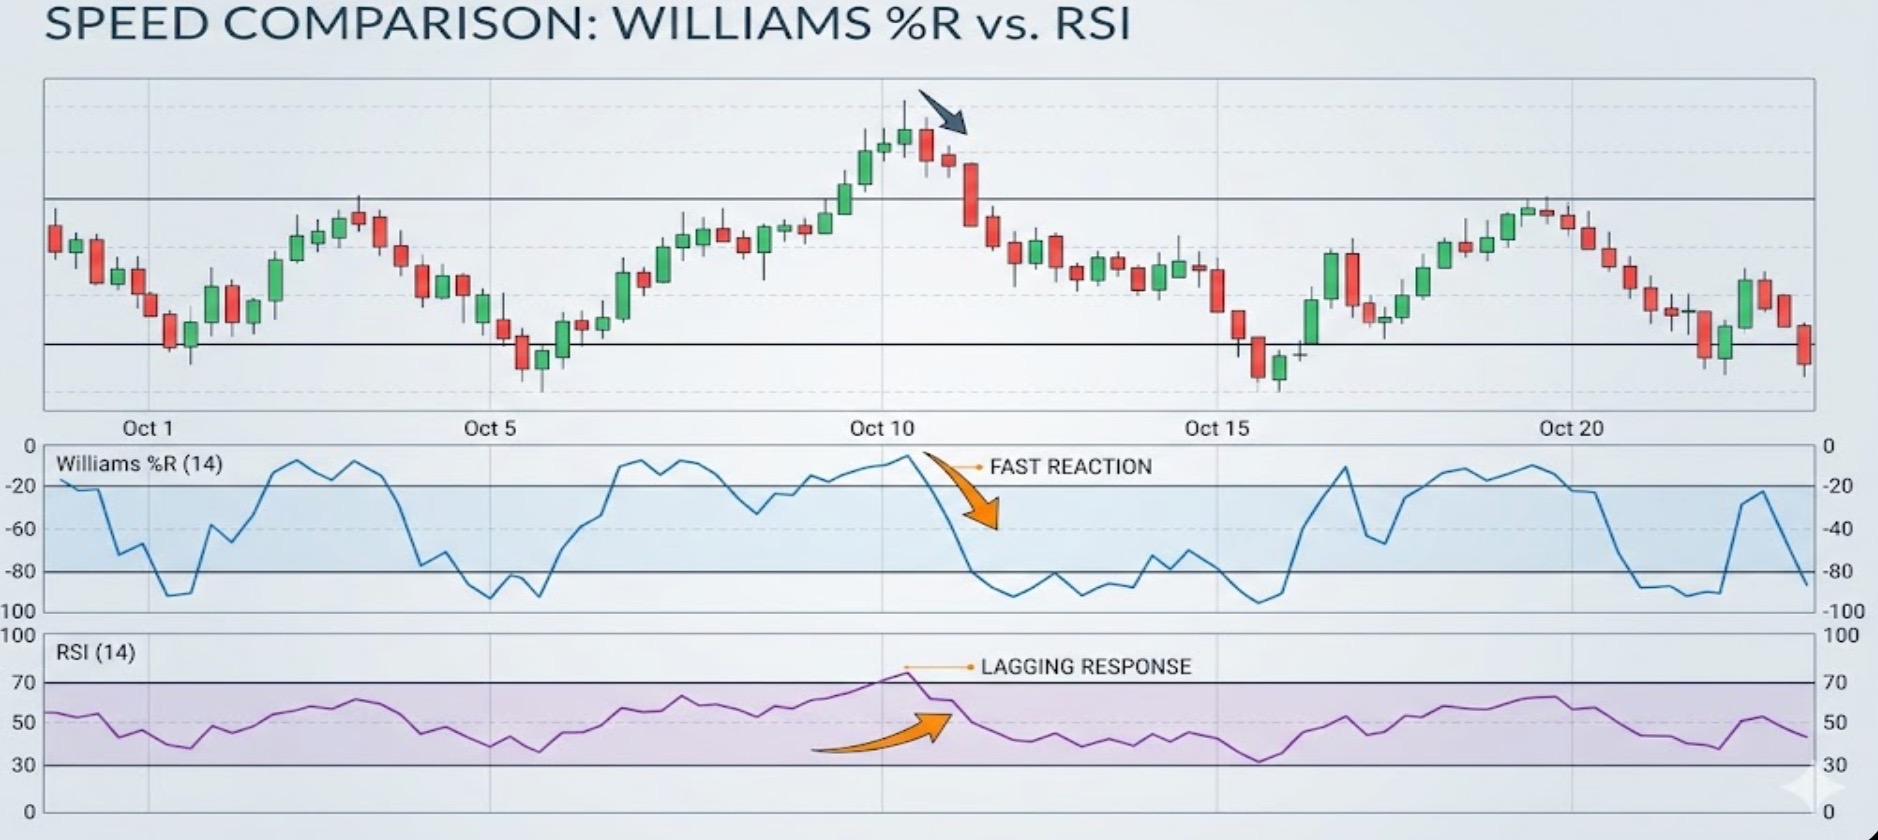
The RSI is a staple on almost every trader's screen, and for good reason—it’s reliable. But in a crypto market that can swing 20% in an afternoon, relying solely on standard oscillators or waiting for moving averages to catch up can sometimes leave you a step behind.
When you need to gauge momentum shifts before the broader market reacts, you have to look at indicators designed for pure speed. Enter the Williams %R.
Created by Larry Williams, this is a hyper-sensitive momentum gauge. It tells you exactly where the current price is relative to its highest peak over a recent period (usually 14 days). We use it heavily on the desk to front-run trend exhaustion. Here’s the actual playbook on how to trade it without getting wrecked by the noise.
The Retail Trap: Shorting a Bull Market
If you’re used to the RSI, the Williams %R scale is going to mess with your head at first. It runs completely in the negative, from 0 down to -100.
-
0 to -20: "Overbought"
-
-80 to -100: "Oversold"
-
-50: The Midline (momentum shift)
I see it every day: a retail trader sees a coin hit -15, thinks "Oh, it's overbought, time to short," and immediately gets their face ripped off in a squeeze.
Here is the reality: In a strong crypto bull run, an asset can technically stay "overbought" for weeks. A reading above -20 doesn't automatically mean a dump is coming; it just means the buyers are completely in control. Shorting an asset simply because the %R crossed -20 is financial suicide.
The Pro Play: Trend Filters and "Momentum Failure"
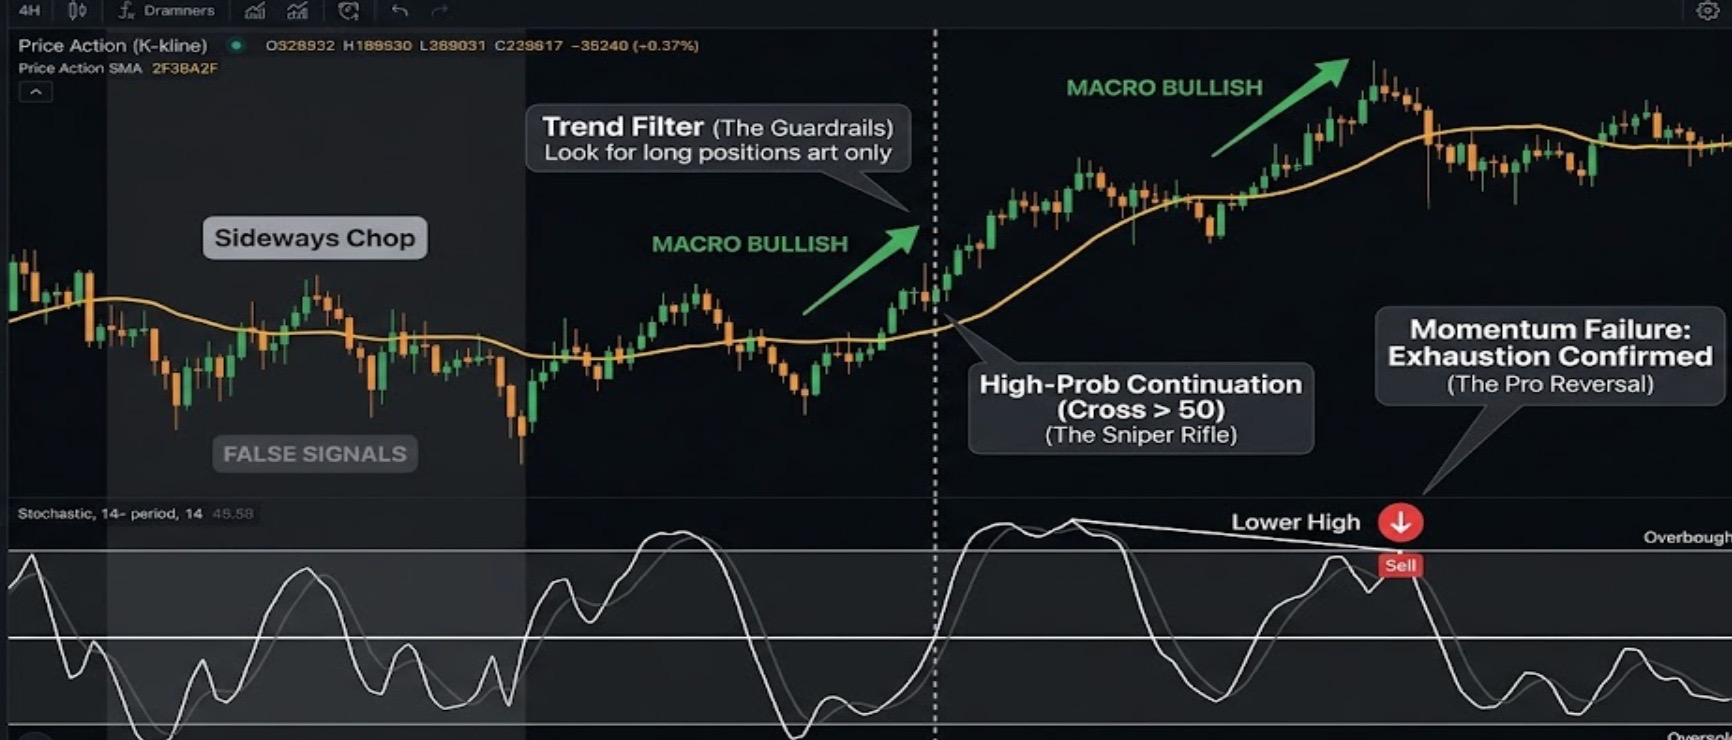
Because fast momentum indicators are so incredibly sensitive, trading them naked on a chart will give you a ton of false signals, especially during sideways chop. To protect capital, you absolutely need a macro trend filter. On the desk, we always anchor the native 14-period Stochastic Oscillator to a standard 20-period Simple Moving Average (SMA).
We look for longs when the price is holding above the 20 SMA, and shorts when it slices below it. Once that trend direction is locked in, we use the Stochastic as our sniper rifle. For a standard continuation trade, waiting for the indicator to simply cross the 50 midline in the direction of your SMA trend is a solid, high-probability trigger.
But when the market goes parabolic and you are hunting for a major reversal, we look for momentum failure. We don't care when the indicator enters the extreme zone; we are waiting for it to fail.
If you want a high-probability short, watch the Stochastic drop out of the overbought zone (falling below 80). Then, wait for it to try and push back up. If it fundamentally fails to cross back above 80, printing a lower high on the indicator, that is your trigger. That lower high is concrete, mathematical proof that the buyers are finally exhausted. That's when you fade the pump. (Desk Note: This executes the exact same mathematical edge as the famous Williams %R strategy, but is natively available right on your standard Tapbit charts).
Why Not Just Use the Stochastic?
People always ask, "Why not just use the Fast Stochastic? They look exactly the same on the chart."
They do draw similar lines, but the math under the hood is different. The Stochastic measures the current price against the lowest lows, while the Williams %R anchors against the highest highs. In crypto, markets are defined by violent, vertical blow-off tops. Because the %R focuses on recent highs, we’ve found it is significantly sharper and faster at flagging early top exhaustion than anything else out there.
Bottom line: The Williams %R is a high-performance engine. It’s incredibly fast, but if you slam the gas pedal without looking at the broader trend, you’re going to crash. Wait for the momentum failure, respect the macro trend, and let the math do the heavy lifting.
Ready to trade the momentum? New to Tapbit? Register here and claim welcome rewards up to 11,000 USDT. Pro Traders: Log in to Tapbit to execute these setups across our deep-liquidity perpetual swap markets.
Frequently Asked Questions (FAQ)
Can I change the 14-period setting?
Absolutely. If you are scalping the 5-minute chart, dropping it to a 7 or 10-period lookback gives you razor-sharp entries, but you have to be ready to manage the extra noise. If you swing trade the daily, push it to 28 periods to filter out the random wicks.
What exactly is a %R divergence?
It’s when the price lies to you, but the indicator tells the truth. If Bitcoin is bleeding out, printing lower lows on the chart, but your Williams %R is quietly making higher lows, that’s a bullish divergence. The downward selling pressure is dying before the price shows it. Smart money accumulates heavily in these windows.
Does it work in a sideways, crab market?
Yes, but you need boundaries. Pair it with Bollinger Bands. Buy when price taps the lower band and the %R is below -80. Sell when price hits the upper band and the %R goes above -20. Just don't get greedy.