A liquidity heatmap in crypto is a visual tool that shows where large amounts of potential liquidity are located across different price levels. Traders use it to identify areas where the market may experience stronger reactions, sharper moves, or increased volatility.
In simple terms, a liquidity heatmap helps answer one question: where might price move if the market starts hunting liquidity?
Crypto markets are heavily influenced by leverage. When traders open leveraged long or short positions, their liquidation prices create areas where forced buying or selling may happen. A liquidity heatmap highlights these areas, usually with brighter colors representing larger liquidity clusters.
How a Liquidity Heatmap Works
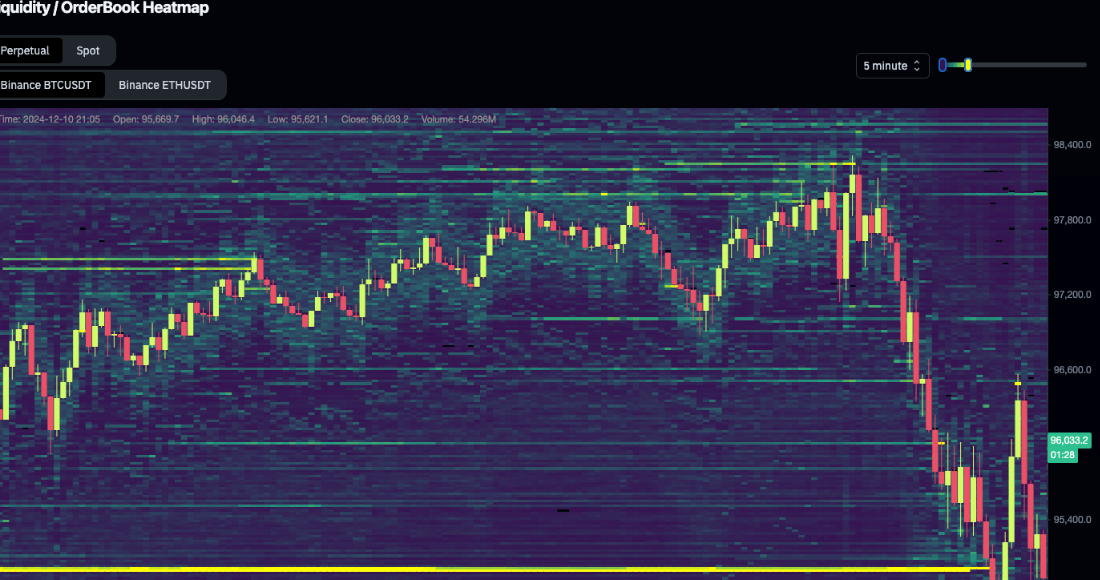
A liquidity heatmap usually displays price levels on one axis and time on another. Colored zones show estimated liquidity concentration. The brighter or stronger the color, the more liquidity may be sitting around that level.
| Heatmap Element | Meaning |
|---|---|
| Bright Zones | Larger estimated liquidity clusters |
| Dark Zones | Lower estimated liquidity |
| Price Levels | Areas where liquidations may occur |
| Time Axis | How liquidity changes over time |
| Clusters | Potential reaction zones |
For example, if Bitcoin is trading at $100,000 and a heatmap shows heavy liquidity around $103,000, traders may watch that level as a possible upside target. If there is also heavy liquidity near $96,000, that area may become a downside magnet if selling pressure increases.
What Are Liquidation Zones?
Liquidation zones are price levels where leveraged traders may be forced out of their positions. If too many traders are long and price falls, their positions may be liquidated, creating forced selling. If too many traders are short and price rises, short liquidations can create forced buying.
This is why price sometimes moves quickly into obvious liquidity areas. The market often seeks levels where large orders, stops, or liquidations are concentrated.
Why Crypto Traders Use Liquidity Heatmaps
Liquidity heatmaps are popular because crypto markets can move fast, especially around Bitcoin, Ethereum, and high-volume altcoins. Traders use heatmaps to understand where volatility may increase.
Common uses include finding possible support and resistance zones, identifying liquidation clusters, spotting potential short squeeze areas, watching long liquidation risk, planning entries and exits, and avoiding overleveraged trades near crowded zones.
For users learning market structure and crypto trading tools, the Tapbit platform can be a useful starting point for exploring broader digital asset markets.
Liquidity Heatmap vs Order Book
A liquidity heatmap is not the same as an order book.
An order book shows current buy and sell orders on an exchange. A liquidity heatmap often estimates potential liquidation levels and liquidity clusters across the market. It gives a broader view of where price may react, but it is not always exact.
| Tool | What It Shows |
|---|---|
| Order Book | Current visible buy and sell orders |
| Liquidity Heatmap | Estimated liquidity and liquidation zones |
| Volume Chart | Actual traded volume |
| Funding Rate | Long or short market bias |
| Open Interest | Total active derivatives positions |
A smart trader does not rely on only one tool. Heatmaps are more useful when combined with volume, open interest, funding rates, and price action.
Can Liquidity Heatmaps Predict Price?
No. A liquidity heatmap does not guarantee where price will go.
It can show important zones, but it cannot tell traders with certainty whether price will move up or down. A large liquidity area above price may act as a magnet during a bullish move, but if market momentum is weak, price may never reach that zone.
The best way to use a heatmap is as a planning tool, not a signal machine.
Main Risks of Using Liquidity Heatmaps
Beginners often make the mistake of treating bright zones as guaranteed targets. That can be dangerous.
| Risk | Explanation |
|---|---|
| False Signals | Liquidity can change quickly |
| Overconfidence | Heatmaps are estimates, not guarantees |
| High Leverage | Traders may get liquidated before price reaches target |
| Market News | News can override technical levels |
| Exchange Differences | Liquidity varies across platforms |
A heatmap can improve awareness, but it cannot replace discipline.
How Beginners Should Use Liquidity Heatmaps
Beginners should start by watching large zones above and below the current price. If price is trapped between two major liquidity clusters, traders can observe which side the market moves toward first.
A simple checklist includes identifying the current trend, marking major liquidity zones above and below price, checking volume and open interest, watching funding rates, avoiding entries too close to liquidation clusters, and using stop-loss and position sizing.
Users can also explore platform campaigns and market access through the Tapbit rewards page, while remembering that trading tools should always be paired with risk management.
Conclusion
A crypto liquidity heatmap is a visual tool that helps traders locate potential liquidation zones and liquidity clusters. It is useful for understanding where volatility may appear and where price may react.
However, heatmaps are not perfect prediction tools. They show areas of interest, not guaranteed outcomes. The most effective traders use them together with trend analysis, volume, open interest, funding rates, and strict risk control.
For beginners, the key lesson is simple: liquidity matters, but risk management matters more.
FAQ
What does a liquidity heatmap show in crypto?
It shows estimated liquidity clusters and possible liquidation zones across different price levels.
Can a liquidity heatmap predict Bitcoin price?
No. It can highlight important zones, but it cannot guarantee direction or timing.
What is a liquidation zone?
A liquidation zone is a price area where leveraged positions may be forcibly closed, creating additional buying or selling pressure.
Is a liquidity heatmap the same as an order book?
No. An order book shows visible current orders, while a heatmap often estimates broader liquidity and liquidation levels.
Should beginners use liquidity heatmaps?
Beginners can use them for market awareness, but they should combine them with trend, volume, funding rates, and strict risk control.