

If you spend any time on crypto social media right now, the consensus is loud and clear: DOGE is dead. After repeatedly losing the $0.15 level and grinding down to test support between $0.09 and $0.11, retail attention has completely evaporated. The timeline is quiet, and the charts look terrible to the untrained eye.
But here on the Tapbit trading desk, we don't trade off social media despair. We trade market mechanics. And right now, the underlying data is flashing a structural signal that we haven't seen in years.
Let's strip away the noise and look at the actual math.
The Weekly RSI: A 12-Year Anomaly
The most critical chart on our monitors right now is the Weekly Relative Strength Index (RSI). Recently, DOGE’s weekly RSI plunged into the 30-34 zone—deep into extreme oversold territory.
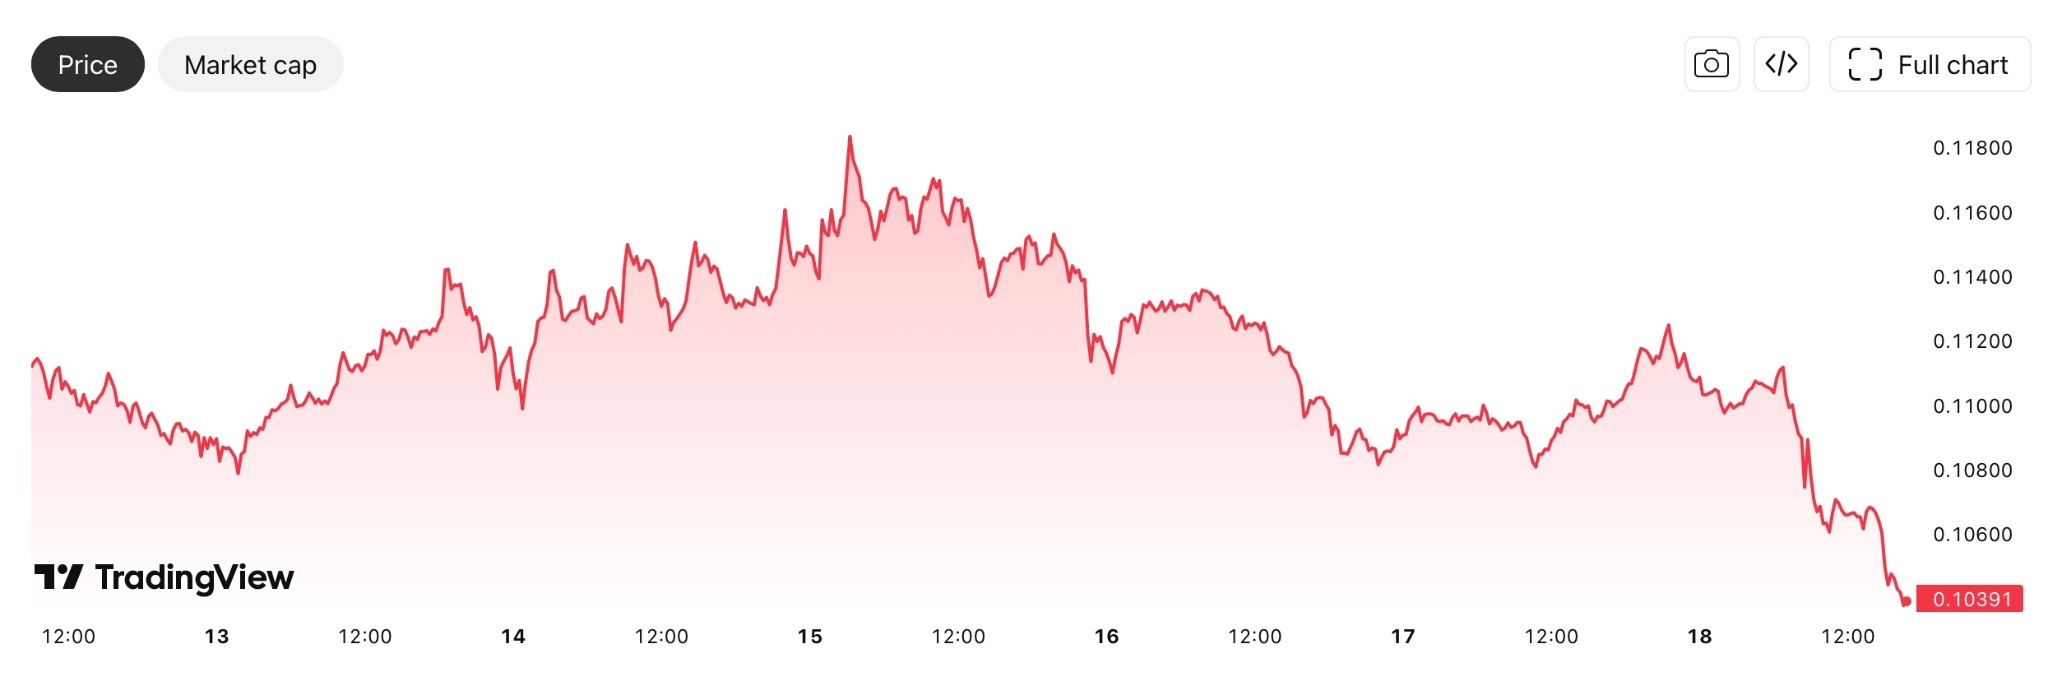
Why does this matter? Because of its historical rarity. Market analyst Cryptollica pointed out that in the entire 12-year history of Dogecoin, the weekly RSI has only dropped into this specific oversold zone three other times:
-
May 2015
-
March 2020 (The brutal COVID-19 liquidity crash)
-
June 2022 (The post-bull market capitulation)
Every single time this happened, it wasn't just a random dip. It marked the absolute macro cycle bottom, completely resetting the market before triggering a massive, parabolic bull run. We are currently staring at the fourth instance in over a decade.
Order Book Reality vs. Retail Despair
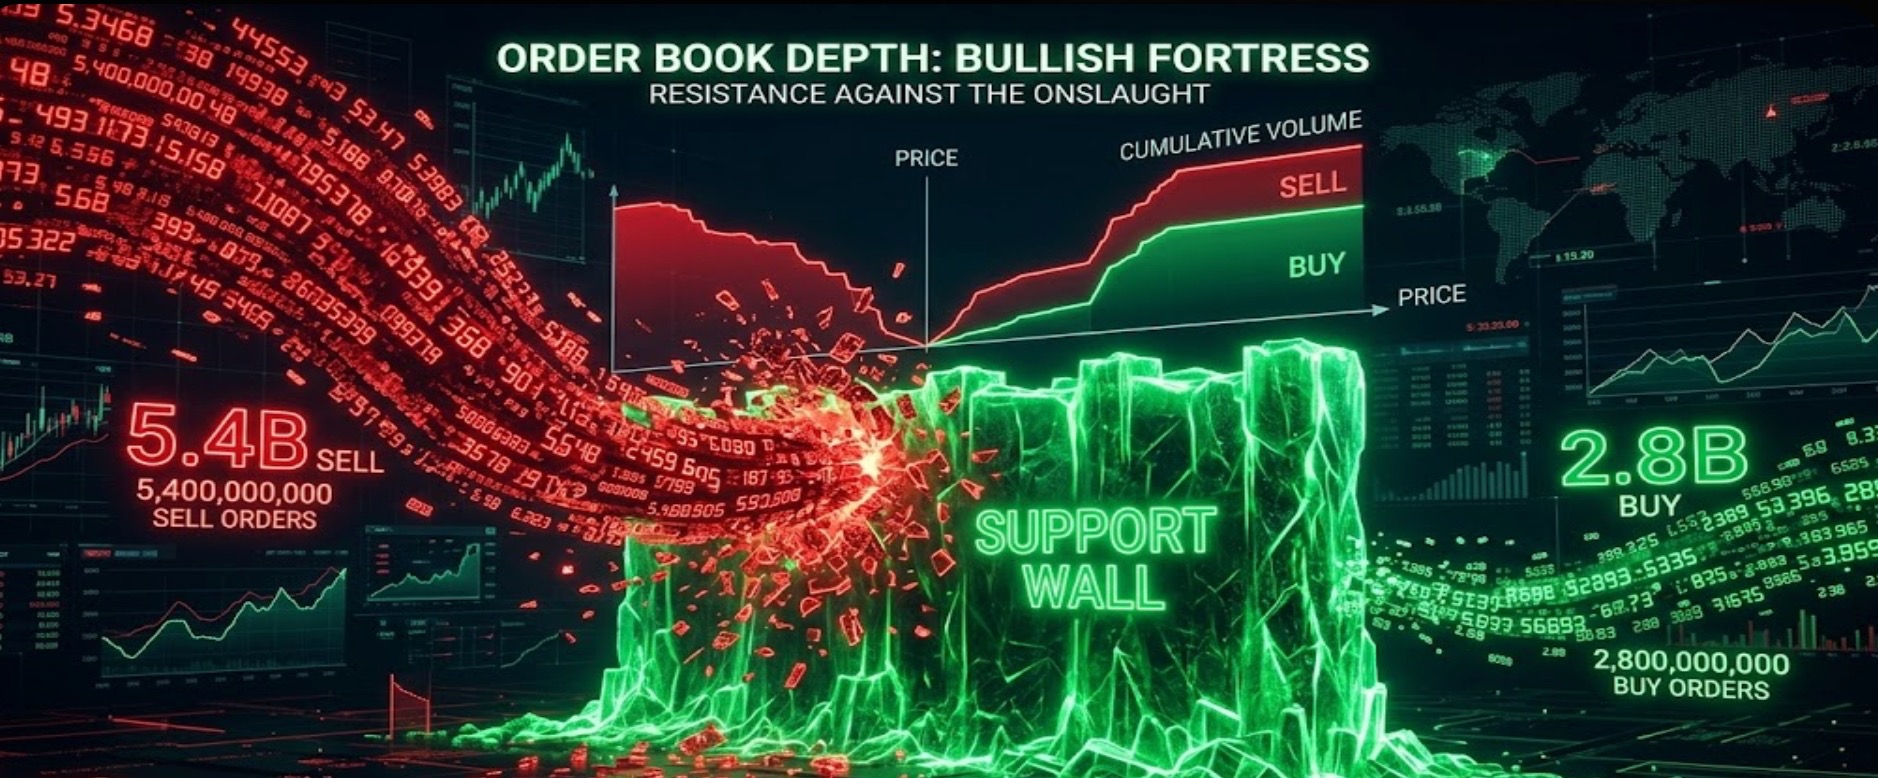
When you look at the current buyer-seller dominance, it looks ugly on the surface. Sell-side capital (roughly $5.4 billion) is still heavily outweighing the buy-side (roughly $2.8 billion).
But momentum is what actually dictates price action. Despite sellers dumping twice as much volume, the downward price movement is actively stalling out. What does this tell us? The sellers are running out of ammunition. When a chart "looks dead" and the price refuses to drop further despite heavy selling pressure, it means the weak hands have already capitulated. The selling is exhausted.
How to Play the Setup
With the selling pressure drying up, the market is quietly setting up two very distinct scenarios:
-
The Short-Term Squeeze: Aggressive traders (like FXRonin) are laser-focused on the $0.088 to $0.092 support zone. If DOGE establishes a firm footing here, the late shorts are going to get trapped. A violent short squeeze could easily snap the price back to the $0.12 to $0.145 range in a very short window.
-
The Macro Play: Zooming out, multiple timeframes are hinting at a MACD golden cross forming alongside a descending wedge breakout. Some analysts are setting conservative mid-term targets between $0.30 and $0.80. If the historical cycle math holds up, Cryptollica is even projecting an ultimate cycle target of $5.
The Bottom Line
Markets always bottom when there is no one left to sell. You have a 12-year RSI anomaly, stalled downward momentum, and absolute peak retail despair. While meme coins are inherently volatile, the structural downside risk right now is shrinking rapidly compared to the historical upside.
Ready to trade the setup?
-
Execute Your Plan: Log in to Tapbit to trade DOGE with deep institutional liquidity and zero slippage.
-
New to the Desk? Register on Tapbit today to claim your welcome pack worth up to 5000 USDT and gain access to our professional charting suite.
Frequently Asked Questions (FAQ)
What exactly is the "12-Year Anomaly" the desk is watching?
It refers to Dogecoin’s Weekly Relative Strength Index (RSI) plunging deep into the 30-34 extreme oversold zone. This is significant because, in DOGE's entire 12-year trading history, this specific technical event is incredibly rare.
What happened the last time DOGE hit these oversold levels?
Prior to now, this Weekly RSI drop has only occurred three times: May 2015, March 2020 (the COVID-19 crash), and June 2022. In every single instance, it marked the absolute macro cycle bottom and acted as the launchpad for a massive, parabolic bull market.
If sell volume is still higher than buy volume, why is this considered a bottom?
It comes down to momentum exhaustion. Right now, sell-side capital ($5.4 billion) outweighs buy-side capital ($2.8 billion). However, the actual downward price movement is stalling out. When heavy selling pressure fails to push the price significantly lower, it tells us that the sellers have run out of ammunition and the "weak hands" have fully capitulated.


