
If you have spent enough time staring at order books on Tapbit, you already know the reality of this industry: cryptocurrency markets are rarely purely rational.
You can draw trendlines and map out Fibonacci retracements all day, but when a sudden macro shock hits, technicals frequently break down. Why? Because algorithms don't panic-sell—humans do. When the market surges, the Fear of Missing Out (FOMO) forces retail money to buy the local top. When prices collapse, capitulation forces those same participants to sell at the absolute bottom.
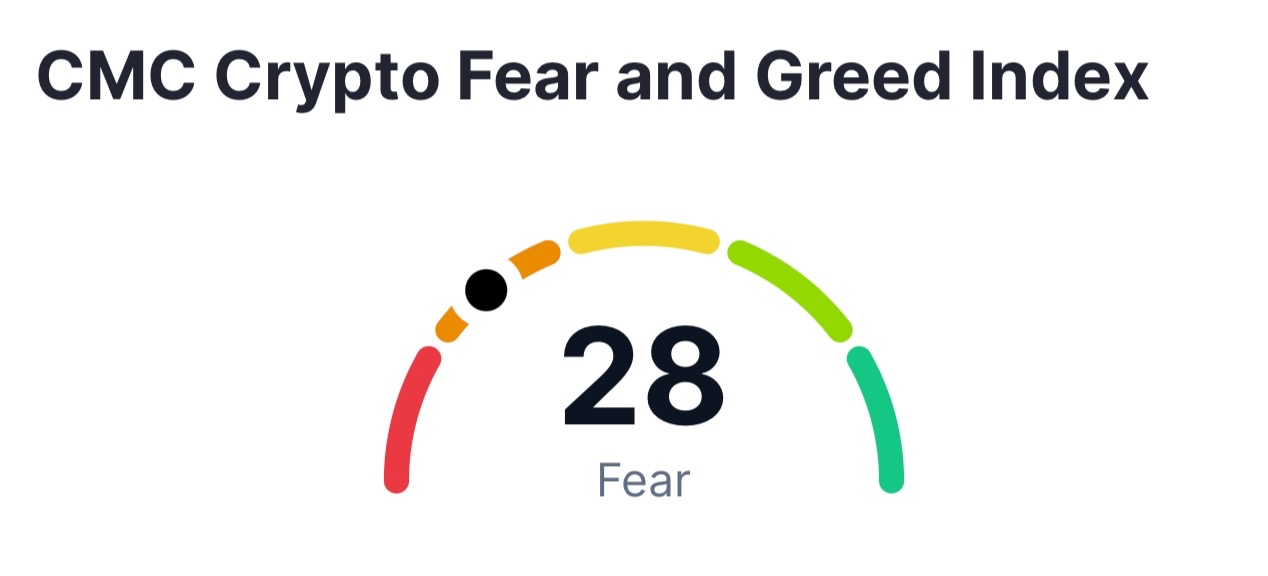
To survive in this environment, professional traders don't just trade price action; they trade human psychology. The most widely respected metric for quantifying this emotional whiplash is the Crypto Fear and Greed Index.
Here is a look under the hood at how this index actually works, what data powers its algorithm, and how institutional-level traders use it to build a contrarian edge.
The Anatomy of the Index
Originally adapted from traditional equities (CNN Business first popularized the concept for the stock market), the crypto-specific index is maintained by the data platform Alternative.me. It ingests a variety of market data and spits out a straightforward daily score from 0 to 100.
-
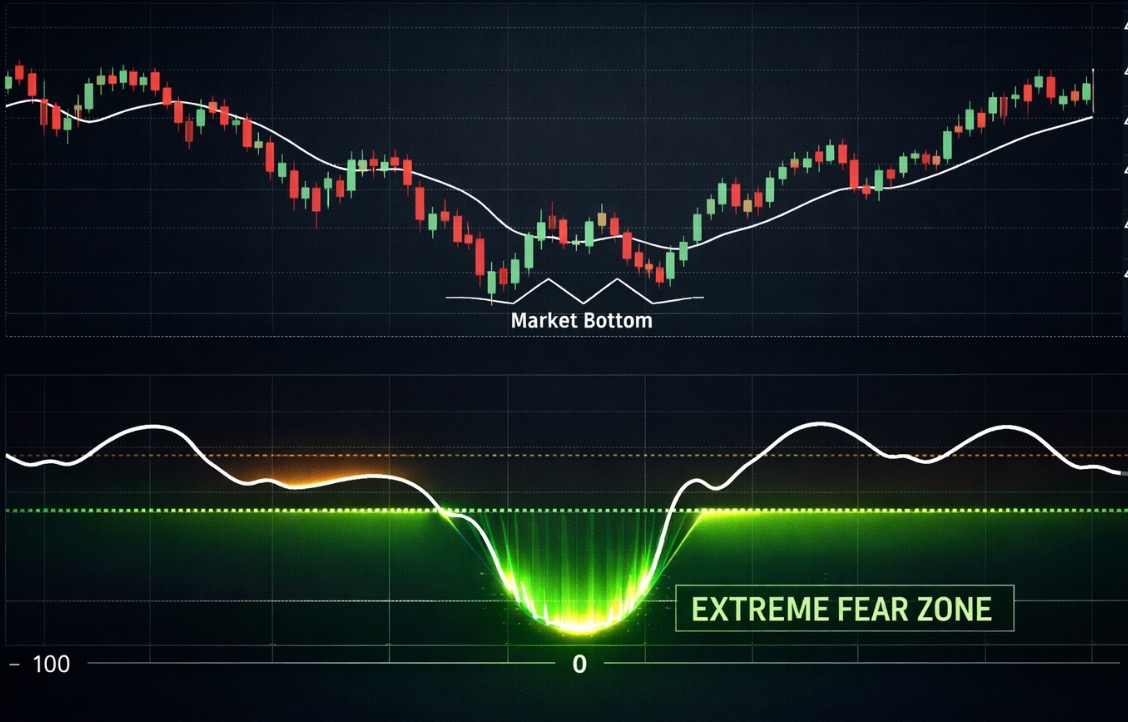
0 – 24 (Extreme Fear): The market is deeply anxious. Retail is capitulating. For contrarian traders, this zone is historically where generational bottoms are formed.
-
25 – 49 (Fear): Selling pressure is dominant. Buyers are sidelined, waiting for a clearer macro signal.
-
50 (Neutral): Equilibrium. Usually seen during periods of boring, sideways consolidation.
-
51 – 74 (Greed): Momentum is building. Participants are taking on more risk to chase yield.
-
75 – 100 (Extreme Greed): Euphoria. The market is irrational, leverage is over-extended, and a sharp correction to wipe out late longs is highly probable.
What Data Drives the Algorithm?
The index isn't based on someone's gut feeling. It is a weighted algorithm that pulls from six distinct data sources, with a heavy bias toward Bitcoin's market behavior:
-
Volatility (25%): The current price action and maximum drawdowns are measured against Bitcoin's 30-day and 90-day averages. Violent downside volatility heavily spikes the "Fear" output.
-
Market Momentum & Volume (25%): High buying volume combined with aggressive upward momentum day-over-day suggests the market is getting greedy.
-
Social Media Sentiment (15%): A text-processing engine scrapes crypto-centric hashtags on X (Twitter). If engagement rates and bullish keywords spike abnormally fast, the algorithm flags it as euphoric public sentiment.
-
Market Dominance (10%): This is a critical flight-to-safety metric. When capital flees high-risk altcoins and parks in Bitcoin, BTC dominance rises—signaling market-wide fear. When dominance drops, it means greedy capital is hunting for high-beta returns in smaller-cap tokens.
-
Google Trends (10%): Search engine data offers a pure look at retail interest. A massive spike in queries for "Bitcoin crash" feeds the fear metric, while surges in "how to buy crypto" indicate rising greed.
-
Surveys (15%): Polling data from market participants. (Note: The developers periodically pause this metric to preserve the integrity of the data).
The Contrarian Edge: Fading the Crowd
Legendary investor Warren Buffett’s famous maxim—"Be fearful when others are greedy, and greedy when others are fearful"—is the exact playbook for this index.
Consider the market conditions we saw earlier in Q1 2026. For weeks, the index flatlined in the single digits, hovering around a score of 8 or 9. To a novice trader, an index score of 8 means the asset class is dead. To a veteran contrarian, a prolonged period of "Extreme Fear" is a massive, flashing buy signal.
When the index sits in extreme fear for an extended period, it indicates that the "weak hands" have been entirely flushed out. Sell pressure is mathematically exhausted. Smart money uses these exact windows of maximum pessimism to quietly accumulate spot positions at a heavy discount. Conversely, when the index hits 85 and your social media feed is full of moon math, it is usually time to tighten your stop-losses and scale out of your positions.
The Blind Spots
Like any quantitative tool, the Fear and Greed Index has blind spots. You should never trade off it blindly:
-
It is Highly Reactive: This is a short-term indicator. It will frequently bounce between fear and greed during standard 20% pullbacks within a larger macro bull run. It does not predict multi-year super-cycles.
-
The Bitcoin Bias: Because the algorithm is heavily weighted toward BTC volatility and dominance, it can completely miss isolated, sector-specific greed (like a sudden explosion in AI or DePIN tokens).
-
Fundamentals Don't Matter Here: The index measures human emotion. It does not care about tokenomics, network upgrades, or macroeconomic liquidity shifts (like M2 money supply or Federal Reserve rate cuts).
The Crypto Fear and Greed Index is your emotional thermometer. It tells you when the crowd is wrong. Combine it with your own technical analysis, strict risk management, and fundamental research to navigate the noise.
Ready to fade the crowd and execute your strategy? Log in to the Tapbit Trading Desk for institutional-grade liquidity and sub-millisecond execution.
Frequently Asked Questions (FAQ)
Can I use the Fear and Greed Index to day-trade altcoins?
It is not recommended as a standalone tool for altcoins. Because the index is heavily anchored to Bitcoin's market data, a specific altcoin can experience a massive, localized "greed" cycle (a pump) even while the broader Bitcoin index registers as fearful or neutral.
Does "Extreme Greed" mean the market is going to crash immediately?
No. Markets can remain irrational longer than traders can remain solvent. "Extreme Greed" simply means the market is over-leveraged and overdue for a correction. It is a signal to manage your risk and perhaps take profits, but it is not a precise timing tool for opening a short position.
Why does rising Bitcoin Dominance indicate "Fear"?
Bitcoin is the reserve currency of the cryptocurrency ecosystem. It is the most liquid and least volatile asset in the space. When investors are afraid of macro-economic shocks or regulatory news, they sell their highly volatile altcoins and move that capital back into Bitcoin for safety. Therefore, a rising BTC dominance shows that the broader market is prioritizing capital preservation over high-yield speculation.