

Walk onto any professional trading floor, and you won't see screens covered in flashy, multi-colored arrows. Retail traders, however, often fall into the trap of searching for a visual cheat code. Enter the Xmaster Formula indicator—a custom script that has gone viral across trading communities for its dead-simple buy and sell signals. But here is the brutal reality: if you are just blindly clicking buttons every time the color changes, you are actively donating your capital to market makers. At the Tapbit Desk, we strip away the hype. To actually profit from this tool, you must ignore the colors and trade the underlying math. Here is the definitive guide to making it work.
The Red and Green Trap

Walk past a rookie's desk, and you will usually see an oscillator flashing bright red and green arrows. The Xmaster Formula indicator is one of the most downloaded custom scripts out there because it looks like a cheat code: green means buy, red means sell.
But if you trade it that way, you are going to get wiped out by market noise.
On the trading desk, we don't buy colors; we buy the underlying math. While the frontend of the Xmaster Formula indicator is built for simplicity, the backend is a heavy-duty hybrid oscillator. It strips out standard, lagging Moving Averages and replaces them with a Least Squares Moving Average (LSMA). The LSMA mathematically fits the actual price curve, allowing it to register momentum shifts much faster than a standard MACD.
More importantly, professional-grade versions of this tool are non-repainting. Once that candlestick closes, the signal is locked in permanently. If your indicator repaints historical data to look more accurate, delete it immediately.
Here is how you actually trade the math instead of the colors.
3 Professional Strategies for the Xmaster Formula Indicator
You have to pair this indicator with market mechanics. Taking every single signal it throws at you is a guaranteed losing strategy.
The Zero-Line Crossover
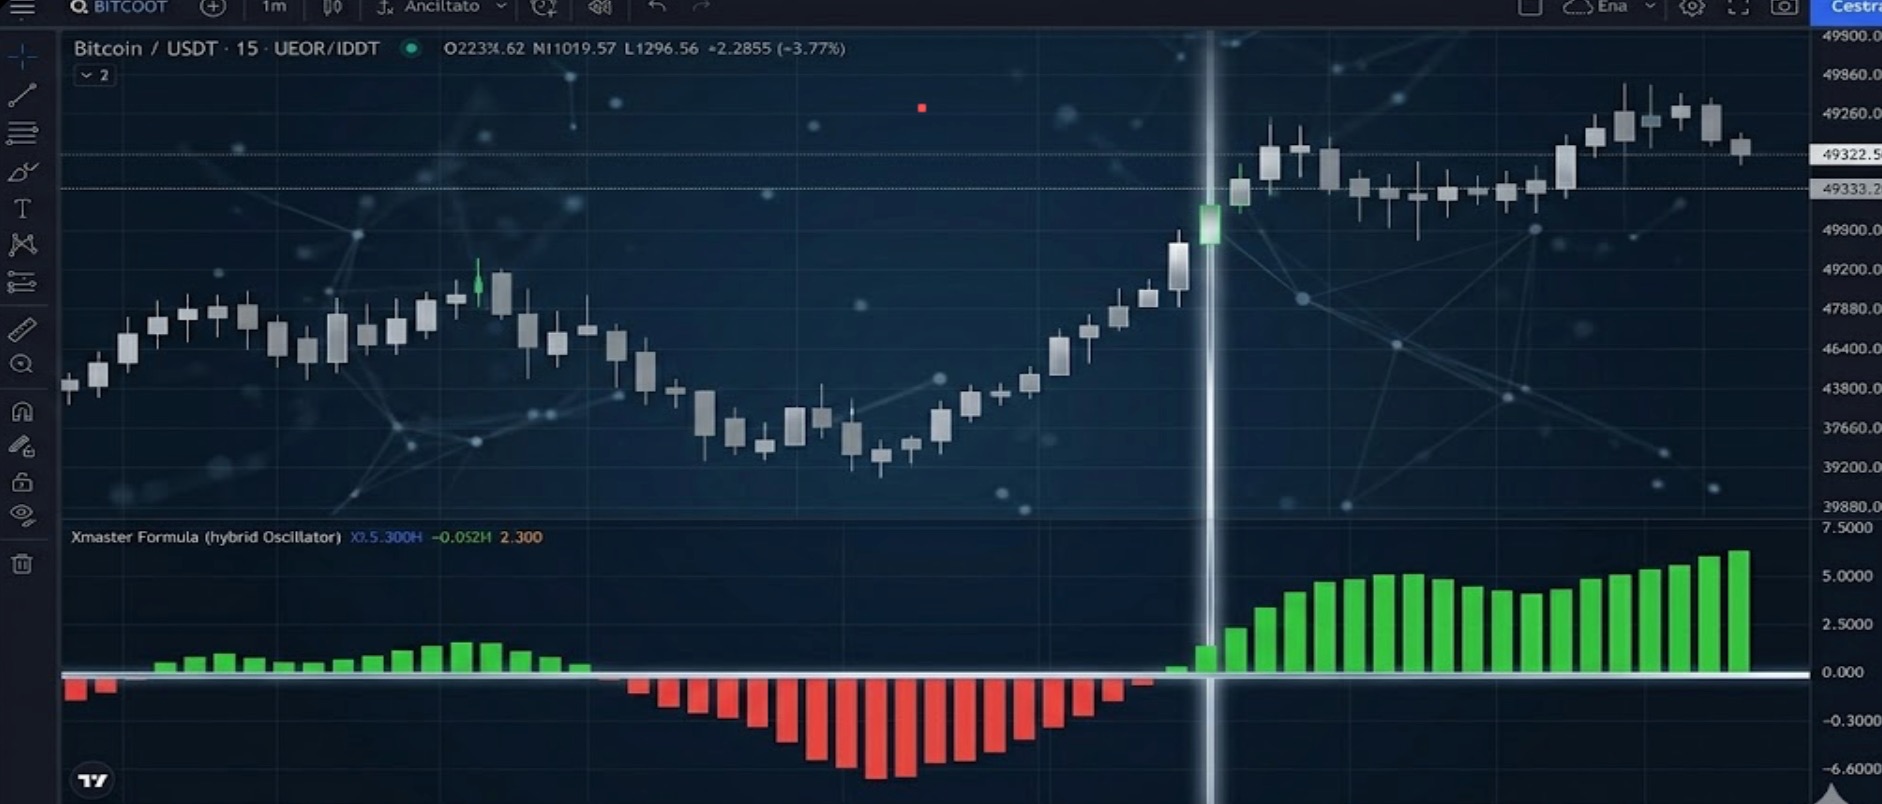
The Xmaster Formula indicator operates in its own sub-window, oscillating around a central "zero-line." Ignore the color flips that happen out in no-man's land and wait for the structural shift.
-
The Long Entry: Wait for the histogram to pull up from negative territory, cross the zero-line into the positive, and turn green.
-
The Short Entry: Wait for the histogram to drop from positive to negative, crossing down through the zero-line while turning red.
-
The Logic: Zero-line crossovers filter out the weak, temporary color changes that trigger during minor mid-trend pullbacks. It forces you to wait for a genuine momentum shift.
Spotting the Divergence
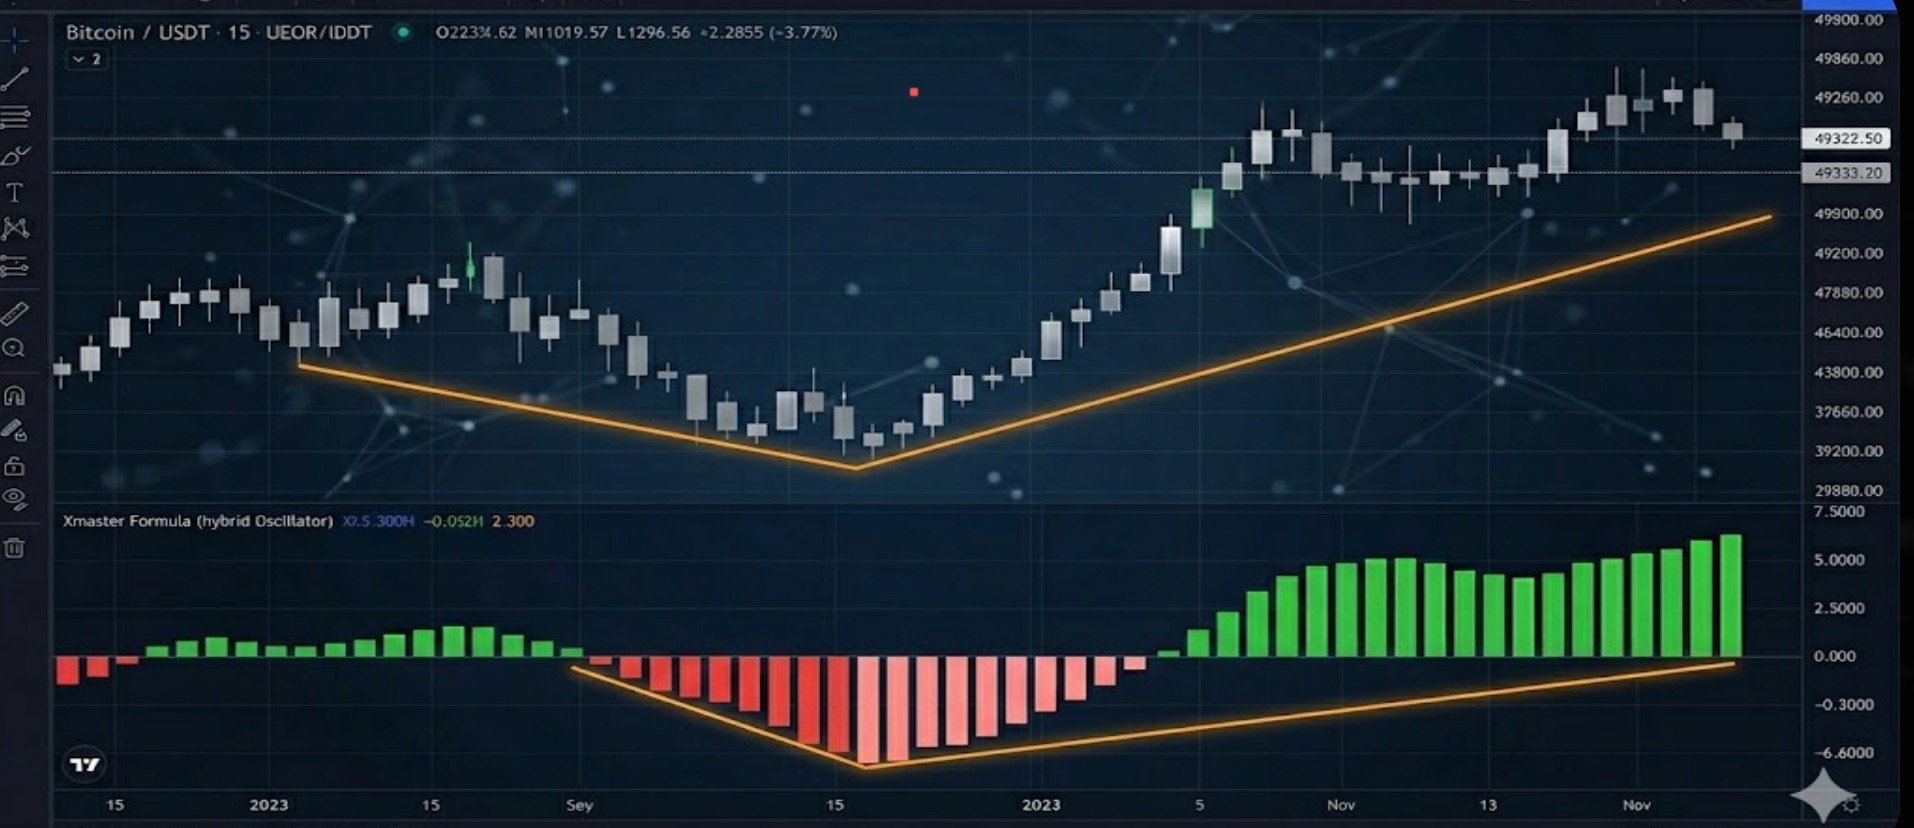
Divergence is the strongest reversal setup in technical analysis, and the LSMA logic inside this indicator maps it out perfectly.
-
Bullish Setup: The price chart prints a lower low, but the Xmaster Formula indicator prints a higher low (moving up toward the zero-line or shifting to a lighter red). The downward pressure is exhausted.
-
Bearish Setup: The price chart hits a higher high, but the indicator prints a lower high. The buyers are out of capital.
-
The Logic: Divergence tells you that the macro order flow is shifting before the price actually breaks. It is infinitely more reliable than waiting for a delayed color change.
The 200 EMA Filter for Scalpers
If you are scalping the M1 or M5 charts, the default settings on the Xmaster Formula indicator will generate an overwhelming amount of noise. You have to restrict your entries. Add a 200-period Exponential Moving Average (EMA) to your main price chart.
-
The Execution: If the price is above the 200 EMA, you only take the green buy signals. If the price is below the 200 EMA, you only take the red sell signals.
-
The Logic: The 200 EMA dictates the institutional trend. This filter prevents you from trying to scalp against heavy institutional flow.
The "Chop Market" Killer
If you spend ten minutes on trading forums, you will see guys claiming the indicator is broken. It isn't broken; they are just using it in the wrong environment.
When market volatility dries up and price action enters a tight, sideways consolidation (a "chop market"), the Xmaster Formula indicator will frantically flip between red and green. If you take those trades, you will be chopped to pieces by spread and trading fees.
The fix is simple: Put the Average Directional Index (ADX) on your chart. If the ADX is reading below 20, the market has no trend. Keep your hands off the keyboard.
Finally, remember that the LSMA still carries a slight lag. Your only valid entry is the first histogram bar that confirms the signal. If you look at the chart and the indicator turned green three candles ago, you missed the trade. Do not chase it.
Ready to execute? Avoid the noise of unregulated DEX pools and Log in to Tapbit. Access our professional charting suite to overlay the 200 EMA and ADX directly onto your live charts. New to the platform? Register on Tapbit today to secure up to 5000 USDT in rewards and start trading institutional-grade setups.
Frequently Asked Questions (FAQ)
What exactly is the Xmaster Formula indicator?
On the surface, it is a custom trading script that flashes green arrows for buy signals and red arrows for sell signals. Under the hood, however, it is a heavy-duty hybrid oscillator. Instead of relying on lagging Moving Averages, it uses a Least Squares Moving Average (LSMA) to mathematically fit the price curve, allowing it to register momentum shifts much faster than a standard MACD.
Does the Xmaster Formula repaint?
Professional-grade versions do not repaint. Once a candlestick closes, the signal is permanently locked in. If you are using a version that retroactively changes historical signals to look more accurate, delete the script immediately.
Should I trade every color change it generates?
Absolutely not. Blindly clicking buy or sell every time the color flips is a guaranteed way to bleed your capital to market makers through market noise. You must pair the indicator with structural market mechanics, such as the 200 EMA, divergence, or zero-line crossovers.


