
Let’s get the hard truth out of the way first: moving averages are lagging indicators. They do not predict the future; they mathematically organize the past.
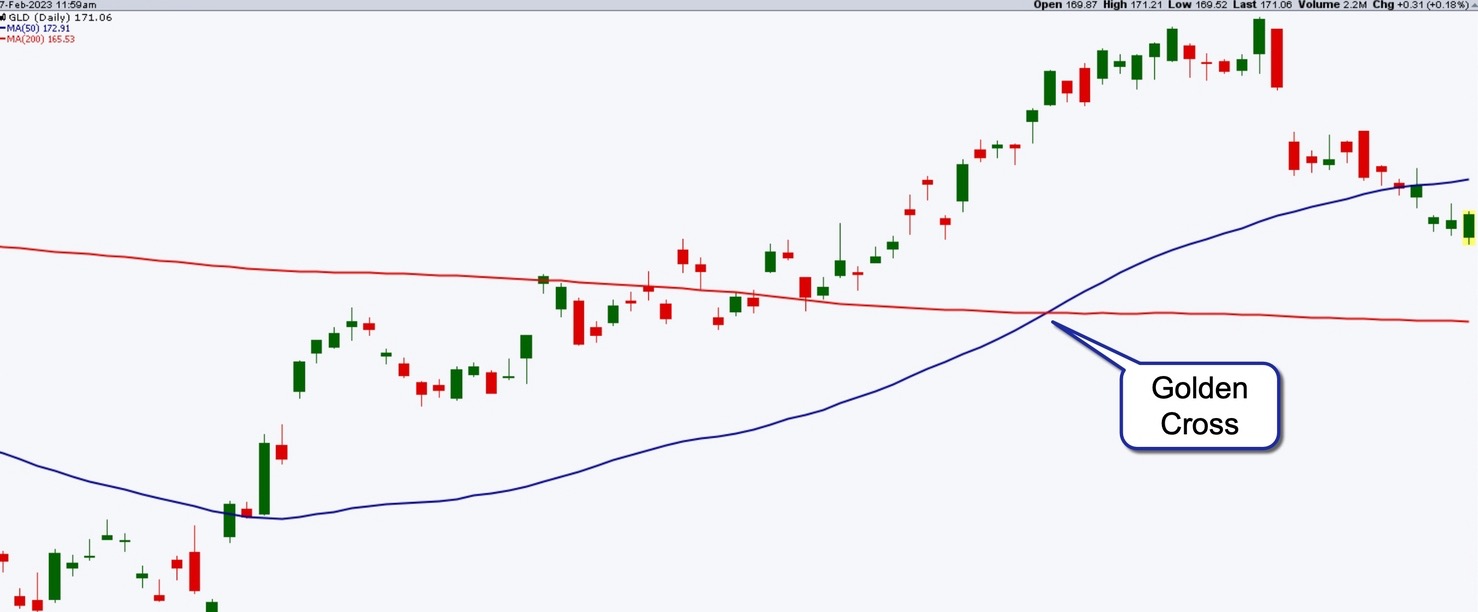
If you are trading the 2026 crypto markets using technical analysis textbooks written for 1990s forex traders, you are providing exit liquidity for institutional algorithms. The classic retail advice is simple: wait for the short moving average to cross above the long moving average (the "Golden Cross"), hit market-buy, and wait for the profit.
On the Tapbit trading desk, we actively trade against that exact setup.
By the time a traditional Simple Moving Average (SMA) crossover prints a clear buy signal on a daily chart, the smart money has already bought the structural bottom, driven the price up 15%, and is actively hunting for retail buyers to unload their positions onto.
But this doesn't mean moving averages are useless. When adjusted for the extreme volatility and high-velocity capital rotation of the current crypto market, they are unmatched for defining macro trends and timing volatility breakouts. Here is the unfiltered reality of how professional desks trade moving averages today.
The SMA is Dead for Intraday. Use the EMA.
If you are day trading or swing trading, the Simple Moving Average (SMA) is a liability. It calculates the average price over a set period, giving a price point from 50 hours ago the exact same mathematical weight as the price from five minutes ago. In a market where a single regulatory headline can wipe 10% off a token's market cap in minutes, the SMA is fatally slow.
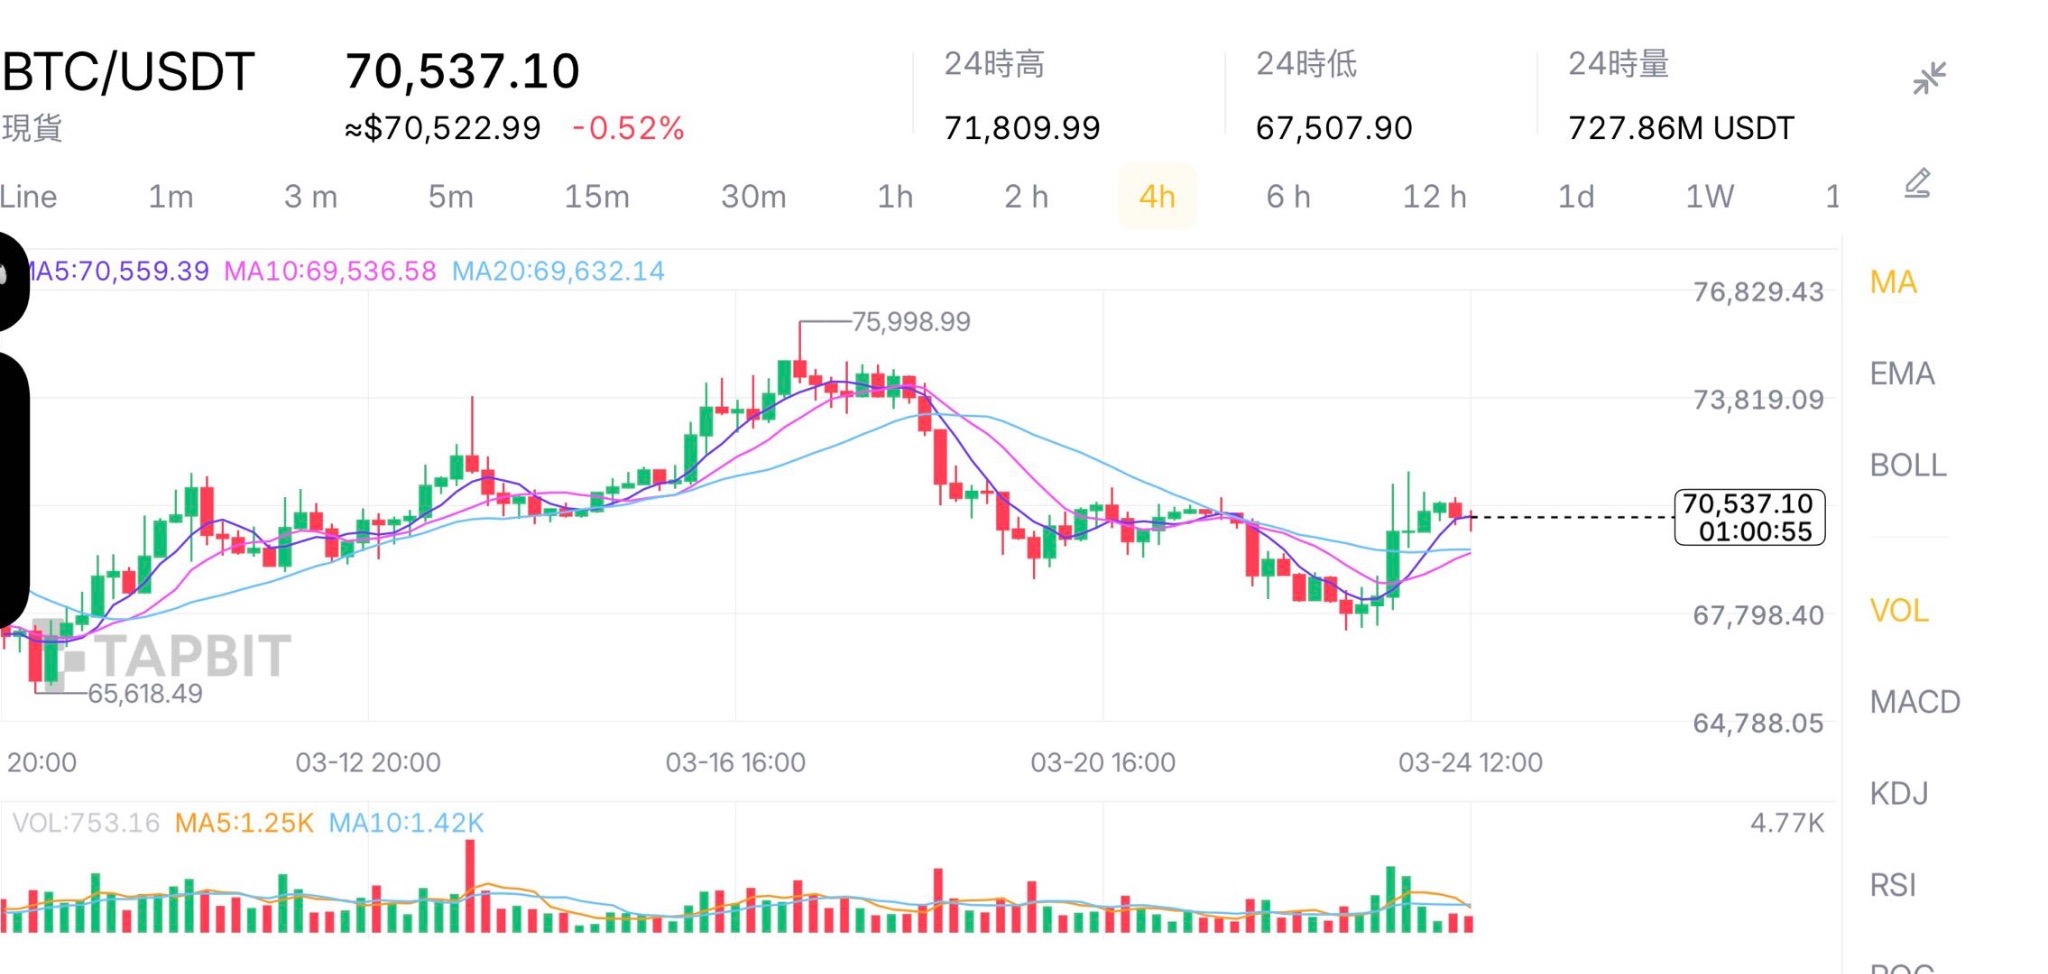
Professional desks almost exclusively use the Exponential Moving Average (EMA) for anything under a daily timeframe. The EMA formula aggressively weights the most recent price action. When the market nukes, the EMA snaps downward instantly, allowing you to identify dynamic resistance levels while retail traders waiting on their SMAs are still holding onto false hope. Keep the 200-day SMA on your daily chart as your macro baseline, but use EMAs for your actual trade execution.
The "Golden Cross" is a Filter, Not a Trigger
We have all been chopped to pieces trading crossovers.
In a massive, sustained parabolic bull run, blindly buying the cross works. But crypto markets spend roughly 70% of their time ranging and consolidating. If you trade crossovers in a sideways market, you will get "whipsawed"—buying the exact local top and shorting the exact local bottom continuously until your margin is wiped out.
Stop using the cross as a trigger to execute a market order. Instead, use it strictly as a directional bias filter. If the 9-EMA crosses above the 21-EMA on a 4-hour chart, it is simply telling your system: Do not look for short setups right now. You do not buy the cross itself. You wait for the price to pull back, test that newly established EMA ribbon as support, and look for a volume-backed rejection. That is where your asymmetric risk-to-reward ratio lies.
Trading the Ribbon "Squeeze"
Overlaying four or five moving averages (e.g., the 20, 50, 100, and 200) on your chart creates a "ribbon." Most amateurs look at the ribbon to see if the lines are fanning out upward or downward to confirm a trend.
Desk traders look at the ribbon for one specific setup: Compression.
Volatility in crypto is cyclical; periods of extreme expansion are always followed by periods of extreme compression. When volatility dies off, price action tightens, and all those moving averages squeeze together into a single, dense horizontal cluster. A tightly coiled moving average ribbon is a ticking time bomb. We monitor these clusters because they represent market equilibrium. We do not guess the direction; we wait for the first high-volume candle to break the cluster, and we trade the subsequent expansion.
MACD: Ignore the Cross, Trade the Divergence
The Moving Average Convergence Divergence (MACD) indicator takes moving averages off the price chart and turns them into a momentum oscillator. Once again, retail is taught to buy when the MACD lines cross.
Most veteran traders hide the MACD lines entirely. We only look at the histogram (the bars), and we exclusively hunt for Divergences.
If a Layer-1 token is pumping and making new higher highs on the price chart, but the MACD histogram is printing lower highs, you have a bearish divergence. It mathematically proves that while the price is rising, the actual buying momentum driving it is dying. The bid side of the order book is exhausted. This is the exact signal institutional traders use to quietly scale out of their long positions while crypto Twitter is still calling for higher targets.
The Execution Reality
Moving averages are a compass. They tell you the current direction of the wind, but they do not sail the ship. Never trade a moving average bounce in absolute isolation. It must be confirmed by raw volume, order book depth, or horizontal support/resistance zones.
When you have your EMAs dialed in and your macro bias set, log in to your Tapbit account. Map out your setups on the advanced charting interface, and never step into the order book without a hard stop-loss.
Frequently Asked Questions (FAQ)
Why do I always get stopped out right on the moving average, only for the price to reverse and go my way?
Because you put your stop-loss exactly where everyone else did. Retail traders predictably place their stops right on the 50-EMA or 200-SMA. Market makers and high-frequency algorithms can see that cluster of resting liquidity. They will intentionally flush the price just below the moving average to trigger your stop-loss (a liquidity sweep), absorb your sell order to fill their own longs, and immediately reverse the price upward. Always place your stops with a structural buffer below the obvious moving average lines.
What are the best moving average settings to use?
There are no "magic" numbers that guarantee profit, but liquidity tends to respect industry standards because so many algorithms are programmed to react to them. For fast momentum, the 9-EMA and 21-EMA combination is heavily watched. For medium-term trend validation, the 50-day is standard. For the ultimate macro baseline dividing bull and bear markets, the 200-day moving average is universally respected.
Should I use moving average envelopes or Bollinger Bands?
Both serve a similar purpose (identifying mean reversion opportunities), but Bollinger Bands adapt to current market volatility because their boundaries are calculated using standard deviations. Envelopes use fixed percentages. Because crypto volatility shifts so violently, Bollinger Bands are generally more effective at showing you when the market is genuinely statistically overextended.