
In the cryptocurrency market, extreme volatility is a constant. Prices can surge or plummet by double digits within minutes. For traders, navigating this landscape without a visual map is a recipe for rapid capital loss.
This is where Technical Analysis (TA) and chart reading transition from optional skills to absolute necessities. At Tapbit, our trading terminal is fully integrated with professional-grade TradingView infrastructure. This guide will walk you through the anatomy of a crypto chart, how to interpret price action, and how to utilize our toolkit to identify high-probability entry and exit points.
1. Why Chart Reading is the Bedrock of Crypto Trading
Without the ability to interpret historical price data, traders rely entirely on emotion—buying green candles out of FOMO (Fear of Missing Out) and panic-selling bottoms. Technical analysis provides a mathematical and visual framework to navigate market psychology.
-
Trend Prediction: The core rule of trading is "the trend is your friend." Charts allow you to instantly identify whether an asset is in an uptrend, a downtrend, or trapped in a sideways consolidation phase.
-
Pinpointing Entry Points: By identifying historical Support (price floors) and Resistance (price ceilings), you can map out exact zones to execute your trades with a high risk-to-reward ratio.
-
Risk Management: Visualizing market structure allows you to set logical, data-backed stop-loss orders rather than guessing where your trade is invalidated.
2. Step-by-Step: Navigating the Tapbit Charting Interface
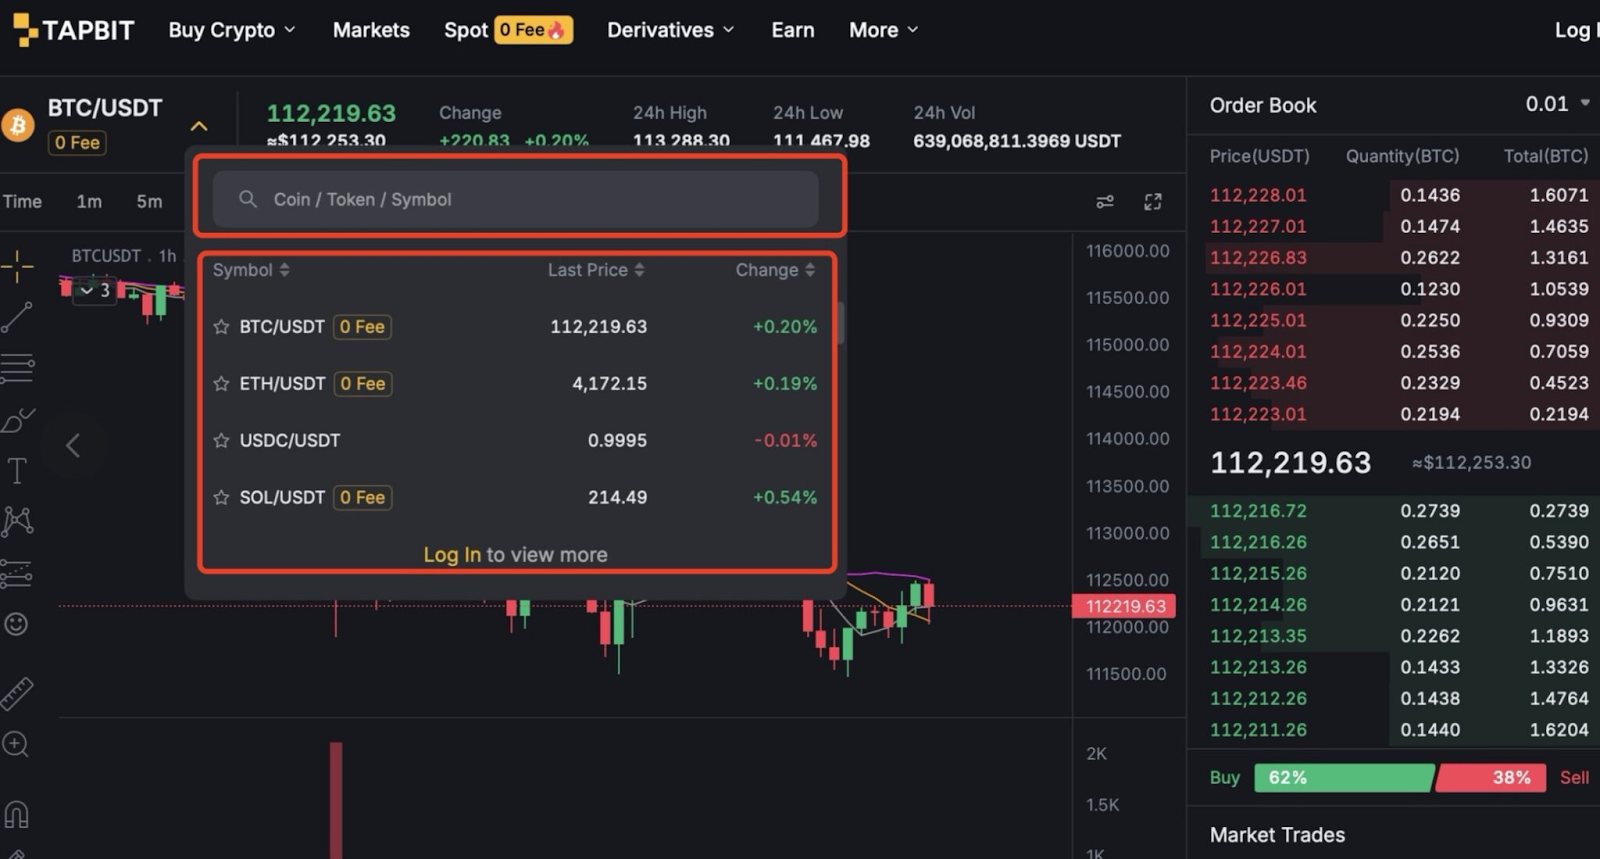
Step 1: Asset Selection
Locate the search bar at the top left of the Tapbit trading interface. Type the ticker symbol of the asset you wish to analyze (e.g., "BTC" for Bitcoin or "SOL" for Solana). Select your desired trading pair (like BTC/USDT) from the dropdown menu to load the real-time price data into the central canvas.
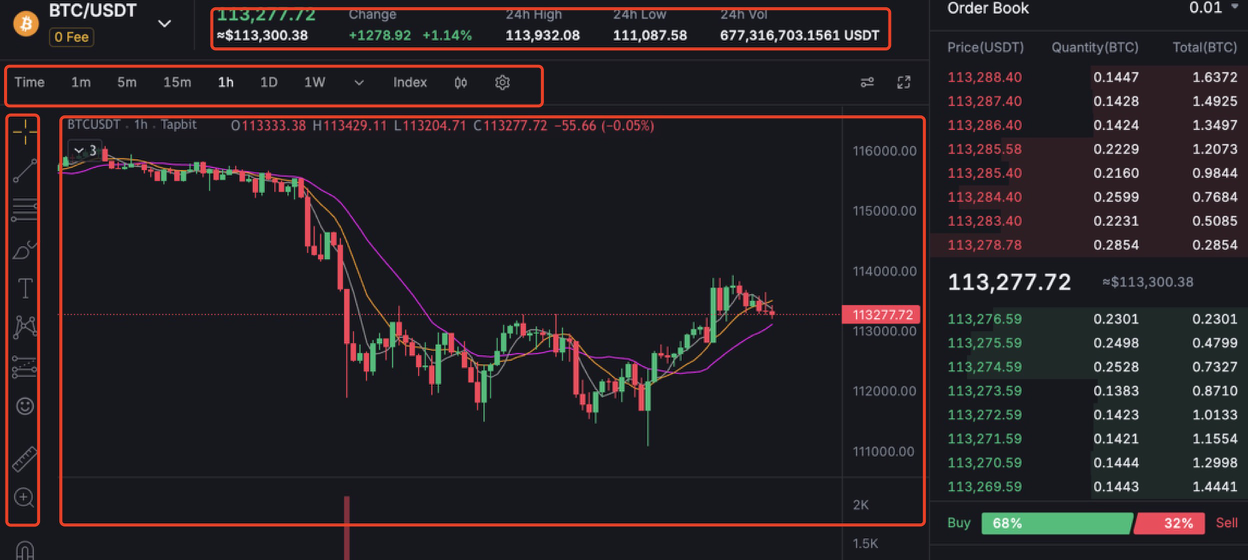
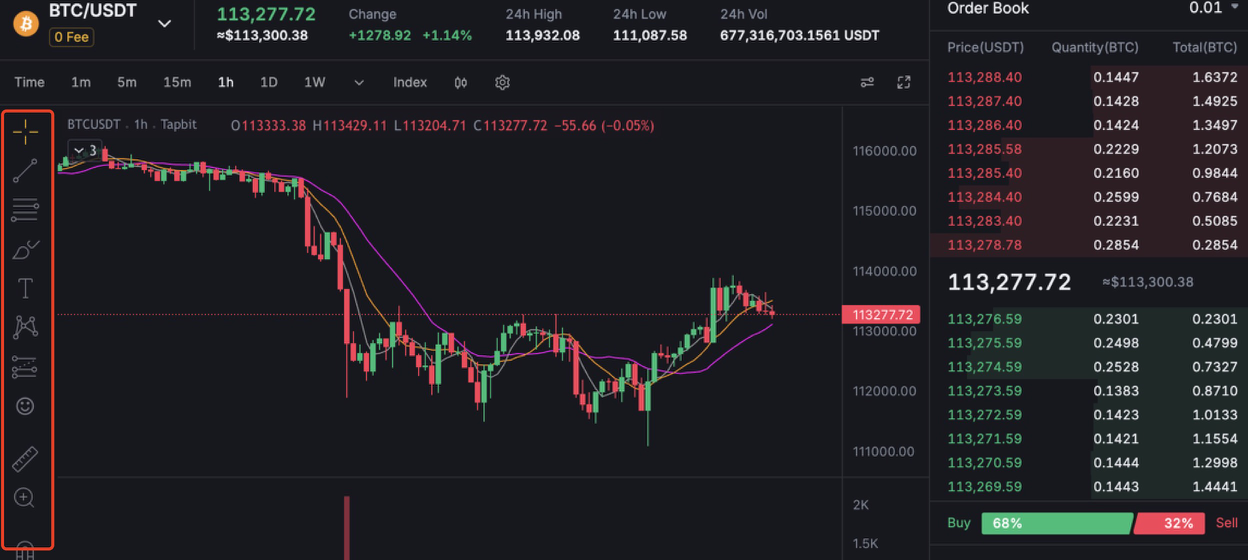
Step 2: The Interface Anatomy
The Tapbit charting area is divided into four primary control zones:
-
The Top Toolbar: Your quick-access menu for adjusting timeframes, switching chart types, and loading pre-saved chart layouts.
-
The Chart Canvas: The central visual space where price action unfolds in real-time.
-
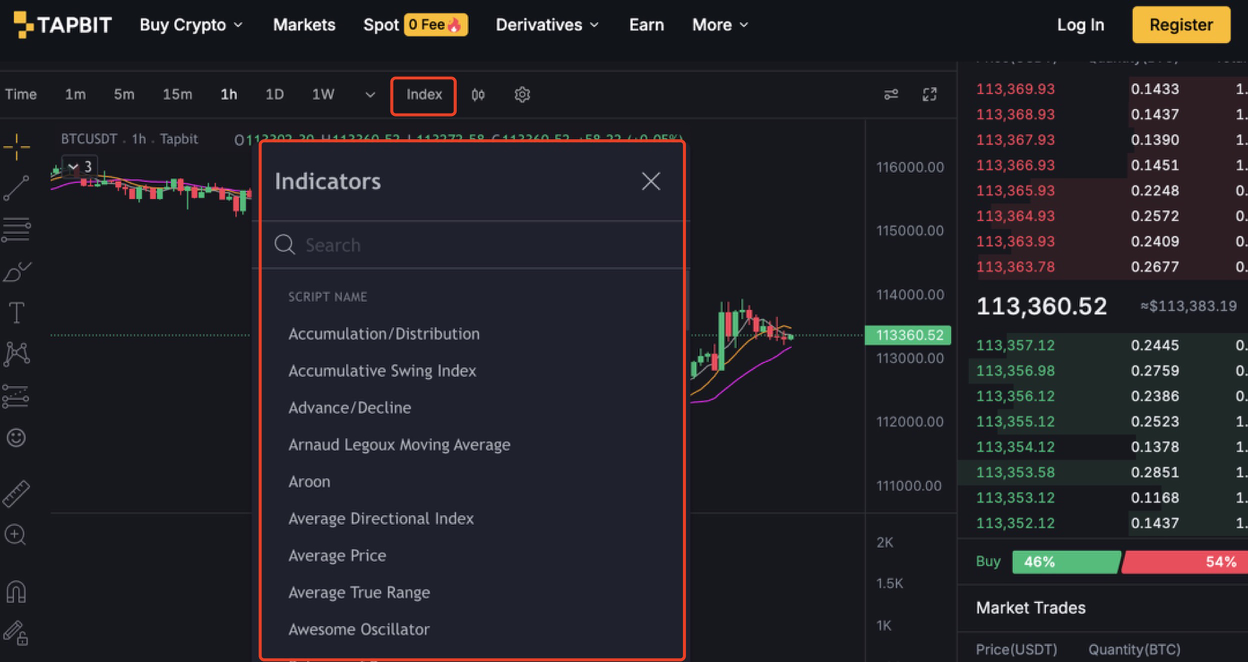
The Indicator Panel (Top): The directory where you can search for and apply complex mathematical overlays (like Moving Averages or Bollinger Bands).
-
The Drawing Suite (Left Side): Your manual toolkit for annotating the chart with trendlines, geometric patterns, and measurement tools.
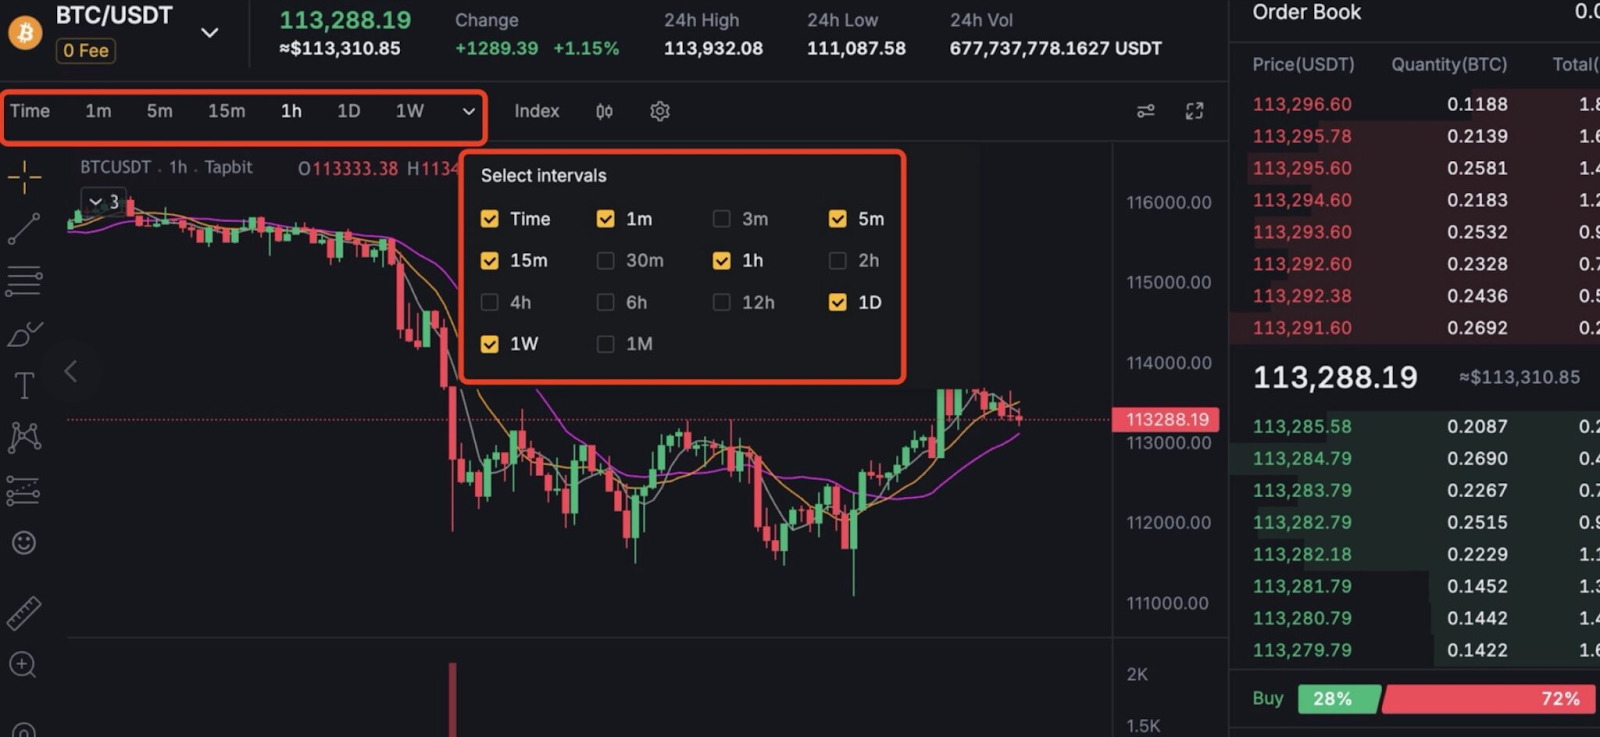
Step 3: Timeframe Alignment
Your timeframe dictates your trading strategy. The toolbar allows you to view price action from tick-by-tick data up to multi-year macro views.
-
Scalpers & Day Traders: Rely on the 1-minute, 5-minute, and 1-hour charts to capture rapid intraday volatility.
-
Swing Traders: Utilize the 4-hour and Daily (1D) charts to capture multi-day or weekly trends.
-
Macro Investors: Focus on Weekly (1W) and Monthly (1M) charts to filter out short-term noise and identify long-term accumulation zones.
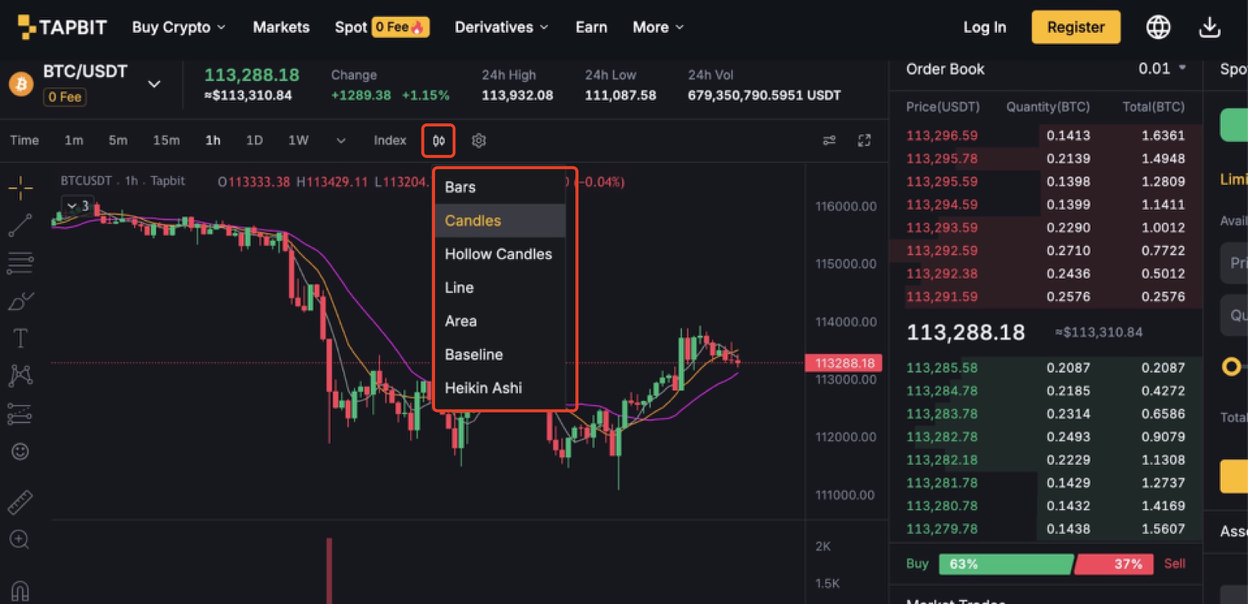
Step 4: Visualizing Price Data (Chart Types)
Tapbit supports multiple visual formats to suit your analytical style:
-
Candlesticks (Standard): The industry default. Each candle displays the Open, High, Low, and Close (OHLC) for a specific period, making it easy to spot momentum shifts and reversal patterns.
-
Heikin Ashi: A smoothed version of candlesticks that mathematically filters out market noise, making prolonged trends much easier to identify.
-
Line Charts: A minimalist view connecting only the closing prices. Excellent for identifying macro trends without the visual clutter of intra-period volatility.
3. Advanced Analysis: Indicators and Annotations
Once you understand the basic structure of the chart, you can begin layering technical tools to build a comprehensive trading thesis.
Layering Technical Indicators
Do not clutter your screen with conflicting data. A professional chart setup usually includes one tool from each of the following categories:
-
Trend Indicators (e.g., Moving Averages, Ichimoku Cloud): These smooth out price data to confirm the broader direction of the market.
-
Momentum Oscillators (e.g., RSI, MACD): These tools measure the speed and strength of a price movement. The Relative Strength Index (RSI), for example, signals when an asset is mathematically "overbought" (due for a pullback) or "oversold" (due for a bounce).
-
Volume Tools (e.g., On-Balance Volume - OBV): Volume precedes price. These tools validate whether a breakout is backed by real institutional capital or if it is a low-volume "fake-out."
Utilizing Drawing Tools
Manual annotation is how you map out your specific trade plan directly on the Tapbit interface.
-
Trendlines & Channels: Draw diagonal lines connecting higher-lows (in an uptrend) or lower-highs (in a downtrend) to visualize the exact trajectory of the asset.
-
Fibonacci Retracement: A vital tool for finding entry points during a pullback. By measuring a recent price surge, Fibonacci levels highlight key mathematical zones (like the 0.618 golden ratio) where the price is highly likely to bounce.
-
Text & Rulers: Use the text tool to write your entry, target, and stop-loss prices directly on the chart so your trading plan is permanently visible.
Put Your Analysis to the Test
Technical analysis is not a crystal ball—it is a framework for probability and risk management. Consistent proficiency in chart reading is developed strictly through screen time and continuous practice.
Tapbit provides the institutional-grade charting tools you need to refine your edge, entirely free of charge within our spot and derivatives terminals.
-
➡️ Ready to analyze the market? Log in to Tapbit and open the BTC/USDT chart to begin plotting your trendlines today.
-
➡️ Need to fund your account first? Visit the Assets Dashboard to deposit crypto or use our fiat on-ramps to purchase USDT.