

Story Highlights
- Bitcoin price has jumped roughly 10% from its recent lows, even as global stocks weaken and silver slides.
- Spot Bitcoin ETFs saw about $8.9 billion in outflows during the correction, but inflows have turned positive as institutions step back in.
- A tight resistance band around $74,000-$76,000 will likely decide whether this move extends toward $90,000 or fades back below $60,000.
Bitcoin Price Climbs as Risk Assets Stumble
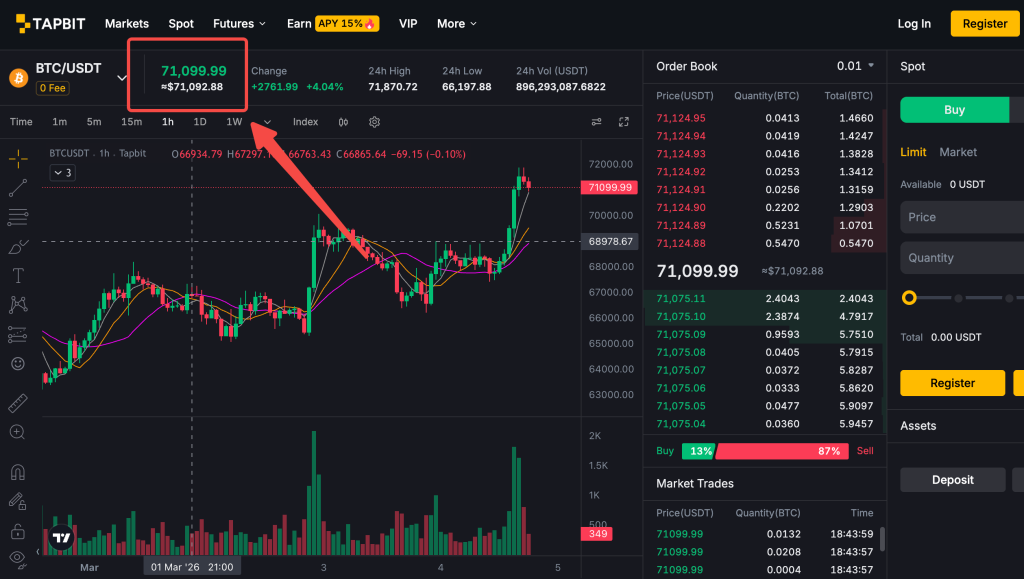
Global markets are flashing risk-off. Equities are under pressure, silver is losing ground and crude oil is firming on rising geopolitical risk. Against that backdrop, the Bitcoin price has pushed up toward $71,099.
After military strikes in the Middle East triggered a slide toward $63,000, Bitcoin has recovered close to 10%. While Asian stock indices retreated and energy markets priced in supply fears, the leading cryptocurrency moved in the opposite direction.
That is not how a textbook risk asset usually behaves. Yet that is exactly what the chart is showing.
Analyst Calls Time on the Bear Phase
One widely followed market analyst argues that the worst of Bitcoin’s bear phase is behind it. Looking at the pattern of higher lows on the chart, the analyst suggests that downside momentum has already broken.
“Constantly higher lows are made on the markets, therefore upside on Bitcoin. The upside on commodities is done. The bear phase for Bitcoin is also done. Good times are ahead,” the analyst wrote.
That is a bold view after five consecutive losing months, the longest negative streak since the deep bear market of 2018. The current rally is now testing whether that call holds up.
Why the Bitcoin Price Is Pushing Higher
The move higher is not happening in a vacuum. Several data points point to a market that was heavily positioned for downside and is now being forced to adjust.
A liquidity provider described the situation bluntly: the market had been pricing in the risk of a broader regional conflict. When escalation did not immediately spill over into a wider war, short sellers began closing positions and volatility subsided.
Spot Bitcoin ETFs provide another layer of context. During the recent correction, these vehicles saw roughly $8.9 billion in net outflows, the largest drawdown since they launched. Over the past five trading sessions, around $1.45 billion has flowed back in, with one of the largest funds flipping from leading the sell-off to leading the recovery.
One ETF specialist highlighted the strength of the rebound in flows, noting the “breadth and depth” of renewed demand even after a 50% drawdown in some positions. Inflows of that scale do not guarantee a trend reversal, but they do signal that large allocators are not walking away.
On-chain and exchange data also suggest that selling pressure is easing. Deposit volumes into centralized exchanges remain low, which typically signals that fewer holders are preparing to sell into rallies.
Taken together, positioning, institutional flows and spot market behavior all point to a market that has worked through a significant amount of forced selling and is now finding support.
Key Bitcoin Price Levels to Watch
The next test for bulls sits in a narrow band just above current levels. On the daily chart, the $74,373-$76,341 zone marks a confluence of the 50-day exponential moving average (EMA50) and the 50-day simple moving average (SMA50).
This area has rejected upside attempts repeatedly since late 2025, turning it into a clear line in the sand. A clean break and sustained hold above this band would open the door to a potential move toward the $90,000 region, according to several technical analysts.
If price stalls and reverses there once again, a deeper retracement toward or even below $60,000 remains on the table. In that scenario, the recent bounce would look more like a classic relief rally inside a broader consolidation range.
Momentum indicators currently sit in a neutral but improving spot. The daily relative strength index (RSI) has climbed to around 54, just above the midpoint between oversold and overbought. Many technical dashboards have flipped to a “buy” bias, although the SMA50 around $76,341 is still flashing a “sell” signal.
In short, the structure of this recovery is improving, but the key resistance wall has not yet been cleared. Active traders should keep an eye on their costs and trading fees as they manage positions around these levels.
Altcoins Follow, But Bitcoin Still Sets the Tone
Major altcoins are participating in the move, though the market cycle still tilts toward Bitcoin dominance. Recent data show Ethereum up around 6.8% on the day, Solana gaining roughly 7.9% and XRP adding more than 5%.
Even so, a widely watched altcoin season index is sitting near 32 out of 100, firmly in “Bitcoin season” territory. That reading implies that, despite pockets of strength across the market, the primary trend and attention remain centered on the Bitcoin price.
Prediction markets echo that focus. One major platform recently assigned roughly a 74% probability that Bitcoin reaches $75,000 within the current month, which lines up almost exactly with the resistance band highlighted by technical analysis.
Whether this proves to be the start of a sustained leg higher or just another relief rally before a deeper pullback, how price behaves around the $74,000-$76,000 zone over the coming weeks is likely to provide the answer.
Tapbit Editorial Standards
Tapbit’s research and news content is produced by a team of market analysts and editors who follow strict guidelines around accuracy, transparency and balance. Key market data points are cross-checked against reputable sources, and charts or indicators are interpreted with a focus on clear, explainable logic rather than sensational claims.
When specific platforms, instruments or tools are mentioned, coverage is based on publicly available information and independent analysis. Readers looking to deepen their understanding of trading concepts, indicators or platform features can explore our comprehensive guides and help resources.
Risk Disclaimer
The views and opinions discussed in this article reflect market conditions at the time of writing and are intended for informational purposes only. They do not constitute financial, investment, legal or tax advice, and should not be treated as a recommendation to buy, sell or hold any digital asset or financial product.
Cryptocurrency markets are highly volatile and involve substantial risk, including the possible loss of principal. Always conduct your own research, consider your financial situation and, if necessary, consult a qualified professional before making trading or investment decisions. Neither the author nor Tapbit is responsible for any losses that may arise from reliance on this analysis.
Some services offered by Tapbit may involve additional terms, conditions and eligibility requirements. Promotional campaigns, welcome rewards and other offers can change or be withdrawn at any time. For the latest information on bonuses and campaigns, visit our welcome rewards page, and if you are ready to engage with the market, you can create an account and begin your journey by joining the platform.