
Think of the entire crypto market as a pizza. Bitcoin is one slice, and everything else (ETH, SOL, stablecoins, memecoins) is the rest. Bitcoin dominance = how big that BTC slice is.
It changes constantly. When BTC attracts more capital than the rest, its share grows. When alts go parabolic, its share shrinks.
The math is simple:BTC Dominance = (Bitcoin Market Cap ÷ Total Crypto Market Cap) × 100%
One important thing: dominance can rise even if BTC’s price is flat (if alts are falling faster), and fall even if BTC is rallying (if alts are rallying harder).
Why Bitcoin Dominance Matters for Every Crypto Trader
In a market where capital can flow between thousands of assets in seconds, knowing where the majority of money is actually sitting is one of the few durable edges a trader can build. Bitcoin dominance is that macro compass. It doesn’t tell you whether a single token will double tomorrow, but it does show whether capital is hiding in Bitcoin, rotating into altcoins, or leaving crypto altogether.
For traders who want to move beyond guessing and learn to anticipate rotations, understanding Bitcoin dominance is non‑negotiable. Used well, it can guide when to prioritise BTC, when to lean into altcoins, and when to de‑risk into cash‑like assets.
The Historical Evolution of Bitcoin Dominance
The history of Bitcoin dominance is effectively the story of crypto’s diversification—from a single‑asset experiment to a sprawling, multi‑sector ecosystem.
From Near‑Monopoly to Competition (2009–2013)
In Bitcoin’s early years, there was no meaningful concept of “dominance” because BTC was the crypto market. Early alternatives existed, but liquidity, security and user adoption were overwhelmingly concentrated in Bitcoin. Dominance hovered close to 100%, and there was little rotation because there were few credible destinations for capital.
The First Major Dilution and the ICO Era
The launch of general‑purpose smart contract platforms dramatically lowered the barrier to issuing new tokens. That, in turn, triggered the first large‑scale issuance boom of initial coin offerings. Capital poured into newly launched projects across payments, infrastructure and speculation, and Bitcoin’s market share fell sharply from dominant levels to a far lower band.
This period was the first true “altcoin season” in which BTC’s share of the pie compressed not because Bitcoin collapsed, but because the rest of the market ballooned around it.
The Mature, Diversified Market
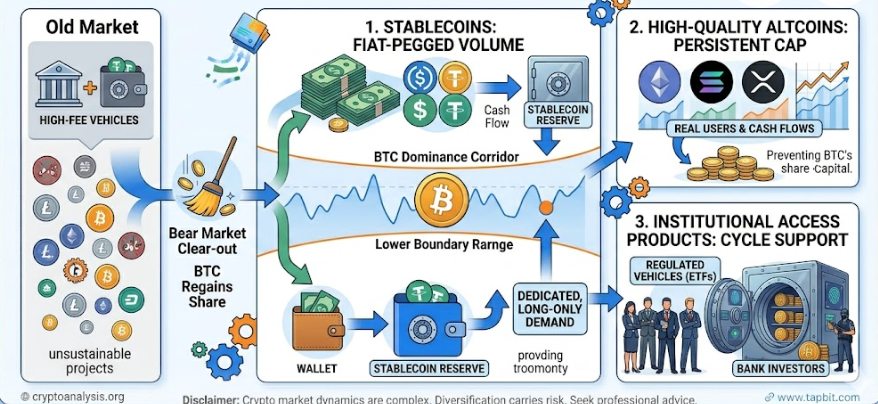
After the subsequent bear market cleared out many unsustainable projects, Bitcoin regained a larger share of total market value. But the ecosystem it reclaimed leadership over looked very different.
Three structural forces now shape Bitcoin dominance:
-
Stablecoins: Fiat‑pegged tokens have grown into a material share of aggregate market cap. When traders move into stablecoins to “sit out” volatility, dominance can decline even if capital has not left crypto.
-
High‑quality altcoins: Platforms and protocols with real users and cash flows now command persistent market caps, limiting how high BTC’s share can sustainably climb.
-
Institutional access products: The rise of regulated vehicles focused primarily on BTC has created a dedicated, long‑only demand base that supports Bitcoin’s share through full cycles.
The result is a more dynamic but bounded dominance range: instead of oscillating between monopoly and collapse, Bitcoin dominance tends to move within a corridor that reflects the tension between its role as reserve asset and the growth of the broader ecosystem.
Bitcoin Market Dominance vs. the BTC.D Index
Traders often use “Bitcoin dominance” as shorthand, but there are two closely related ways it appears in practice: a broad market share statistic and a chartable index designed for technical analysis.
Macro Market Dominance
The macro version is the percentage typically displayed on data aggregators and dashboards. It is a relatively slow‑moving figure that tracks the share of total market cap captured by BTC on a snapshot basis.
This view is best suited for higher‑timeframe questions: Is crypto capital concentrating into Bitcoin or spreading into sectors like AI, gaming, or DeFi? For example, if total market cap is rising but Bitcoin dominance is flat, it suggests new value is being created in non‑BTC sectors rather than being pulled into Bitcoin itself.
The Technical BTC.D Index
The chartable BTC.D index, available on professional platforms, transforms that percentage into a time series that can be analysed like any other market instrument. You can apply:
-
Moving averages (SMA/EMA): To identify medium‑ and long‑term trends in dominance.
-
Oscillators like RSI: To gauge whether BTC’s market share looks stretched to the upside or downside relative to recent history.
-
Fibonacci levels and patterns: To project potential retracement zones where dominance rallies or declines may pause.
For traders carrying significant altcoin exposure, BTC.D can even become part of a hedging framework. If you see dominance breaking out of a consolidation pattern while holding a basket of smaller coins, tightening risk or partially rotating into BTC can help protect accumulated gains.
The Four Quadrants: Turn Dominance Into a Signal
Combine BTC price trend with dominance trend, and you get four market regimes:
|
BTC Price |
Dominance |
What’s Happening |
What to Do |
|
↑ Up |
↑ Rising |
Capital flows into BTC, alts get drained |
Go heavy on BTC, avoid alts |
|
↑ Up |
↓ Falling |
Bull market, but alts pump harder |
Lean into alts, chase beta |
|
↓ Down |
↑ Rising |
Crypto weak, but BTC holds up better |
Rotate into BTC or stables |
|
↓ Down |
↓ Falling |
Money is leaving crypto entirely |
Cut risk, protect capital |
Use this as a filter. At least you’ll know which environment you’re in.
Where to Track Bitcoin Dominance
Because crypto trades around the clock, having reliable data on Bitcoin dominance is essential if you want to incorporate it into your strategy.
Professional Charting and Analytics
On advanced charting platforms, you can pull up the BTC.D index and overlay your preferred indicators—moving averages, trendlines, oscillators and more. Some on‑chain analytics providers also offer refined variants such as realised cap dominance, which adjust for when coins last moved instead of only marking them to current price.
Aggregators and Exchange Dashboards
For fast checks, major market data aggregators publish headline Bitcoin dominance alongside total market cap on their front pages. Many trading interfaces now also surface dominance metrics or related sentiment gauges inside the trading dashboard.
When combining dominance analysis with actual execution, working from a single interface can be efficient. On Tapbit, you can create an account, monitor market structure, and execute spot or derivatives trades without juggling multiple platforms. Our trading fees schedule is transparent, so you can factor costs directly into your rotation strategies.
FAQ
Does a high Bitcoin dominance mean I should only hold BTC?
Not necessarily. High Bitcoin dominance often signals a market shift toward safety, but it doesn’t mean traders should hold only BTC. Many investors stay overweight Bitcoin during strong dominance trends, then gradually rotate into altcoins when dominance stabilizes or shows signs of reversing.
How do token burns affect Bitcoin dominance?
Token burns reduce the circulating supply of an asset. If this leads to a lower market cap relative to Bitcoin, dominance may increase. However, if the burn drives price appreciation, the effect can be neutral or even reduce Bitcoin dominance.
What is “real” Bitcoin dominance?
“Real” Bitcoin dominance refers to adjusted metrics that exclude certain assets such as stablecoins, illiquid tokens, or low-quality projects. These filtered versions aim to provide a clearer picture of Bitcoin’s relative strength within the core crypto market.
Why is Bitcoin dominance important for traders?
Bitcoin dominance helps traders understand market cycles. Rising dominance often signals risk-off conditions, while falling dominance can indicate capital flowing into altcoins. It’s commonly used to time portfolio allocation between BTC and alternative assets.